#XAGUSD @ 22.825 Silver prices drop as trades at around $22.85, down 0.33%.
…
This is a premium post.
[s2If !current_user_can(access_s2member_level4)]Please register for FREE REGISTER to read full post below containing analysis. In case of any error or you think you are not able to read the full post below, please email us at support#nehcap.com [lwa][/s2If] [s2If current_user_can(access_s2member_level1)]
- Silver prices drop as XAG/USD trades at around $22.85, down 0.33%.
The pair currently trades last at 22.825.
The previous day high was 23.21 while the previous day low was 22.66. The daily 38.2% Fib levels comes at 22.87, expected to provide resistance. Similarly, the daily 61.8% fib level is at 23.0, expected to provide resistance.
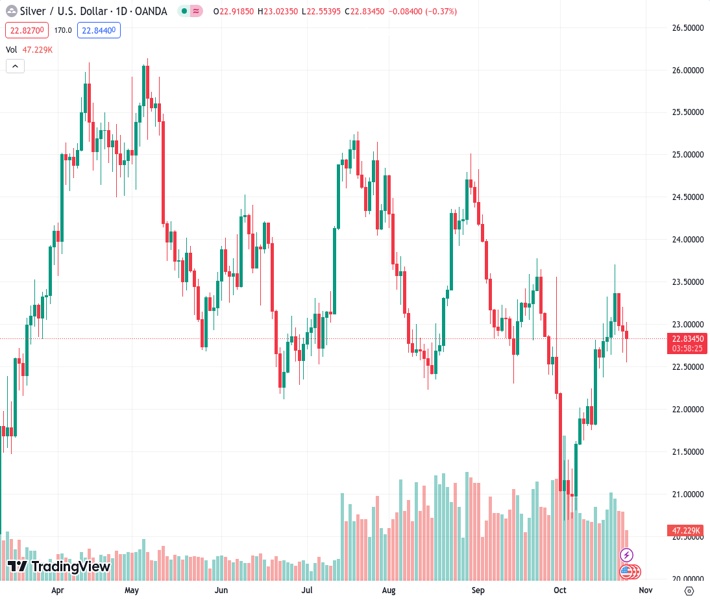
Silver prices (XAG/USD) dropped in the mid-North American session on Wednesday as market sentiment turned negative, which usually underpins the grey metal. Nevertheless, an uptick in US Treasury bond yields and a strong US Dollar (USD), capped the XAG/USD advance towards the $24.00 figure. At the time of writing, Silver exchanges hands at $22.85, down 0.33%.
After sliding below the 200 and 50-day moving averages (DMAs), the XAG/USD remains downward biased, though shy of testing the 20-day Exponential Moving Average (DMA) at $22.20. A breach of the latter would expose $22.00, followed by the bottom of the Bollinger-Band at $20.77, but firstly, sellers must reclaim $21.00.
On the flip side, if XAG/USD reclaims the 50-DMA at $22.94, Silver could challenge the $23.00 figure, followed by the 200-DMA at $23.29, ahead of the top of the Bollinger-Bands at $23.69.
Technical Levels: Supports and Resistances
XAGUSD currently trading at 22.86 at the time of writing. Pair opened at 22.92 and is trading with a change of -0.26 % .
| Overview | Overview.1 | |
|---|---|---|
| 0 | Today last price | 22.86 |
| 1 | Today Daily Change | -0.06 |
| 2 | Today Daily Change % | -0.26 |
| 3 | Today daily open | 22.92 |
The pair is trading above its 20 Daily moving average @ 22.2, below its 50 Daily moving average @ 22.95 , below its 100 Daily moving average @ 23.28 and below its 200 Daily moving average @ 23.31
| Trends | Trends.1 | |
|---|---|---|
| 0 | Daily SMA20 | 22.20 |
| 1 | Daily SMA50 | 22.95 |
| 2 | Daily SMA100 | 23.28 |
| 3 | Daily SMA200 | 23.31 |
The previous day high was 23.21 while the previous day low was 22.66. The daily 38.2% Fib levels comes at 22.87, expected to provide resistance. Similarly, the daily 61.8% fib level is at 23.0, expected to provide resistance.
Note the levels of interest below:
- Pivot support is noted at 22.65, 22.38, 22.1
- Pivot resistance is noted at 23.2, 23.48, 23.75
| Levels | Levels.1 |
|---|---|
| Previous Daily High | 23.21 |
| Previous Daily Low | 22.66 |
| Previous Weekly High | 23.70 |
| Previous Weekly Low | 22.37 |
| Previous Monthly High | 24.82 |
| Previous Monthly Low | 22.12 |
| Daily Fibonacci 38.2% | 22.87 |
| Daily Fibonacci 61.8% | 23.00 |
| Daily Pivot Point S1 | 22.65 |
| Daily Pivot Point S2 | 22.38 |
| Daily Pivot Point S3 | 22.10 |
| Daily Pivot Point R1 | 23.20 |
| Daily Pivot Point R2 | 23.48 |
| Daily Pivot Point R3 | 23.75 |
[/s2If]
Download Nehcap EAWe have two EAs that are operational on our LIVE accounts.
- EA-FIX: Check out the details here. Download EA-FIX . EA-FIX is a non-grid HFT scalper.
- EA-GROWTH: High quality low dd EA using trend grids. Download EA_GROWTHJoin Our Telegram Group
")


