#USDCAD @ 1.37390 struggles to attract follow-through buying amid subdued USD price action.
…
This is a premium post.
[s2If !current_user_can(access_s2member_level4)]Please register for FREE REGISTER to read full post below containing analysis. In case of any error or you think you are not able to read the full post below, please email us at support#nehcap.com [lwa][/s2If] [s2If current_user_can(access_s2member_level1)]
- USD/CAD struggles to attract follow-through buying amid subdued USD price action.
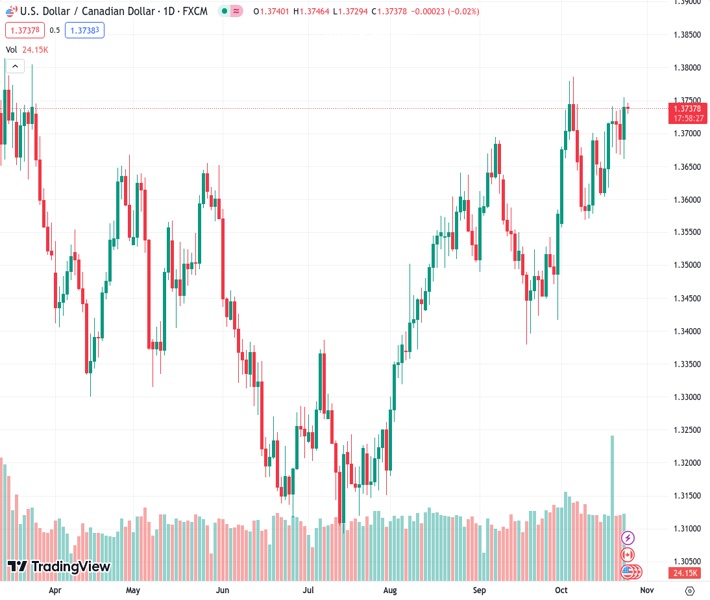
The pair currently trades last at 1.37390.
The previous day high was 1.3755 while the previous day low was 1.3661. The daily 38.2% Fib levels comes at 1.3719, expected to provide support. Similarly, the daily 61.8% fib level is at 1.3697, expected to provide support.
The USD/CAD pair struggles to capitalize on the overnight goodish intraday rally of around 90 pips from a multi-day low and oscillates in a narrow band during the Asian session on Wednesday. Spot prices currently trade just below mid-1.3700s, or a near three-week high touched on Tuesday as traders keenly await the Bank of Canada (BoC) policy decision before positioning for the next leg of a directional move.
The Canadian central bank is expected to keep its benchmark interest rates unchanged at a 22-year high of 5.0% for the second consecutive month in October on the back of eroding consumer and business confidence. The BoC may also show less conviction in the need for a more aggressive policy tightening in the wake of signs of easing inflationary pressures. This, along with the recent decline in Crude Oil prices, is seen undermining the commodity-linked Loonie and acts as a tailwind for the USD/CAD pair.
Heading into the key central bank event risk, bullish traders seem reluctant to place fresh bets in the wake of subdued US Dollar (USD) price action. Retreating US Treasury bond yields, along with a generally positive risk tone, fail to assist the safe-haven Greenback to build on the previous day’s solid rebound from over a one-month low. This, in turn, is seen as a key factor acting as a headwind for the USD/CAD pair. The downside for the USD, however, remains limited amid hawkish Federal Reserve (Fed) expectations.
The flash version of the US PMIs released on Tuesday showed that business activity in the manufacturing sector moved out of contraction territory for the first time in six months, and services activity accelerated modestly in October. This was seen as a sign that the US economy remains resilient despite a surge in interest rates, which should allow the Fed to stick to its rate-hiking cycle to tame inflation. The outlook, meanwhile, should limit any meaningful downfall for the US bond yields and favour the USD bulls.
The aforementioned fundamental backdrop suggests that the path of least resistance for the USD/CAD pair is to the upside and corrective declines might still be seen as a buying opportunity. Spot prices seem poised to climb further towards challenging a multi-month peak, around the 1.3785 region touched on October 6. Some follow-through buying, leading to a subsequent strength beyond the 1.3800 mark, will confirm a fresh breakout and pave the way for a further near-term appreciating move.
Technical Levels: Supports and Resistances
USDCAD currently trading at 1.374 at the time of writing. Pair opened at 1.374 and is trading with a change of 0.0 % .
| Overview | Overview.1 | |
|---|---|---|
| 0 | Today last price | 1.374 |
| 1 | Today Daily Change | 0.000 |
| 2 | Today Daily Change % | 0.000 |
| 3 | Today daily open | 1.374 |
The pair remains strongly bullish on the daily timeframe. It trades above its 20 SMA @ 1.3651, 50 SMA 1.3589, 100 SMA @ 1.343 and 200 SMA @ 1.3474.
| Trends | Trends.1 | |
|---|---|---|
| 0 | Daily SMA20 | 1.3651 |
| 1 | Daily SMA50 | 1.3589 |
| 2 | Daily SMA100 | 1.3430 |
| 3 | Daily SMA200 | 1.3474 |
The previous day high was 1.3755 while the previous day low was 1.3661. The daily 38.2% Fib levels comes at 1.3719, expected to provide support. Similarly, the daily 61.8% fib level is at 1.3697, expected to provide support.
Note the levels of interest below:
- Pivot support is noted at 1.3683, 1.3625, 1.3589
- Pivot resistance is noted at 1.3776, 1.3812, 1.387
| Levels | Levels.1 |
|---|---|
| Previous Daily High | 1.3755 |
| Previous Daily Low | 1.3661 |
| Previous Weekly High | 1.3741 |
| Previous Weekly Low | 1.3606 |
| Previous Monthly High | 1.3694 |
| Previous Monthly Low | 1.3379 |
| Daily Fibonacci 38.2% | 1.3719 |
| Daily Fibonacci 61.8% | 1.3697 |
| Daily Pivot Point S1 | 1.3683 |
| Daily Pivot Point S2 | 1.3625 |
| Daily Pivot Point S3 | 1.3589 |
| Daily Pivot Point R1 | 1.3776 |
| Daily Pivot Point R2 | 1.3812 |
| Daily Pivot Point R3 | 1.3870 |
[/s2If]
Download Nehcap EAWe have two EAs that are operational on our LIVE accounts.
- EA-FIX: Check out the details here. Download EA-FIX . EA-FIX is a non-grid HFT scalper.
- EA-GROWTH: High quality low dd EA using trend grids. Download EA_GROWTHJoin Our Telegram Group
")


