#EURJPY @ 158.645 was seen in the 158.93 – 158.70 range, trading relatively quiet.
…
This is a premium post.
[s2If !current_user_can(access_s2member_level4)]Please register for FREE REGISTER to read full post below containing analysis. In case of any error or you think you are not able to read the full post below, please email us at support#nehcap.com [lwa][/s2If] [s2If current_user_can(access_s2member_level1)]
- EUR/JPY was seen in the 158.93 – 158.70 range, trading relatively quiet.
The pair currently trades last at 158.645.
The previous day high was 159.92 while the previous day low was 158.54. The daily 38.2% Fib levels comes at 159.06, expected to provide resistance. Similarly, the daily 61.8% fib level is at 159.39, expected to provide resistance.
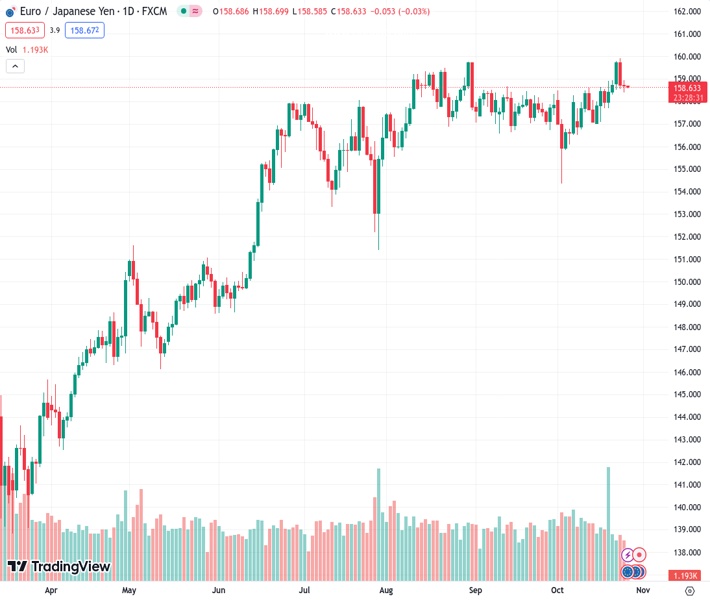
In Wednesday’s session, the EUR/JPY consolidated Tuesday losses and traded in a narrow range after declining by 0.65% on Tuesday and clearing all Monday gains. At the beginning of the week, the cross jumped to a multi-year high of 159.90, it highest level since 2008, but the buyers are struggling to hold that momentum.
On the daily chart, there is a neutral to bearish technical outlook as the bulls are losing traction. The Relative Strength Index (RSI) turned flat in positive territory, while the Moving Average Convergence (MACD) displays lower green bars. Furthermore, the cross has continued side-ways trading since late July in the 154.00 – 160.00 range, with both parties struggling to make a move beyond those levels. However, on the broader scale, the pair is above the 20,100,200-day Simple Moving Average (SMA), highlighting the continued dominance of bulls.
That being said, the JPY could get additional momentum as higher Japanese government bond yields amid monetary policy tweak speculations could act as a catalyst and revive the buying momentum. On Thursday, the European Central Bank (ECB) announces its monetary policy decision which could also provide impetus to the pair.
Support levels: 158.50, 158.00, 157.00.
Resistance levels: 159.00, 159.50, 160.00.
Technical Levels: Supports and Resistances
EURJPY currently trading at 158.62 at the time of writing. Pair opened at 158.77 and is trading with a change of -0.09 % .
| Overview | Overview.1 | |
|---|---|---|
| 0 | Today last price | 158.62 |
| 1 | Today Daily Change | -0.15 |
| 2 | Today Daily Change % | -0.09 |
| 3 | Today daily open | 158.77 |
The pair remains strongly bullish on the daily timeframe. It trades above its 20 SMA @ 157.76, 50 SMA 157.96, 100 SMA @ 156.83 and 200 SMA @ 150.94.
| Trends | Trends.1 | |
|---|---|---|
| 0 | Daily SMA20 | 157.76 |
| 1 | Daily SMA50 | 157.96 |
| 2 | Daily SMA100 | 156.83 |
| 3 | Daily SMA200 | 150.94 |
The previous day high was 159.92 while the previous day low was 158.54. The daily 38.2% Fib levels comes at 159.06, expected to provide resistance. Similarly, the daily 61.8% fib level is at 159.39, expected to provide resistance.
Note the levels of interest below:
- Pivot support is noted at 158.23, 157.69, 156.85
- Pivot resistance is noted at 159.61, 160.46, 161.0
| Levels | Levels.1 |
|---|---|
| Previous Daily High | 159.92 |
| Previous Daily Low | 158.54 |
| Previous Weekly High | 158.93 |
| Previous Weekly Low | 157.06 |
| Previous Monthly High | 158.66 |
| Previous Monthly Low | 156.58 |
| Daily Fibonacci 38.2% | 159.06 |
| Daily Fibonacci 61.8% | 159.39 |
| Daily Pivot Point S1 | 158.23 |
| Daily Pivot Point S2 | 157.69 |
| Daily Pivot Point S3 | 156.85 |
| Daily Pivot Point R1 | 159.61 |
| Daily Pivot Point R2 | 160.46 |
| Daily Pivot Point R3 | 161.00 |
[/s2If]
Download Nehcap EAWe have two EAs that are operational on our LIVE accounts.
- EA-FIX: Check out the details here. Download EA-FIX . EA-FIX is a non-grid HFT scalper.
- EA-GROWTH: High quality low dd EA using trend grids. Download EA_GROWTHJoin Our Telegram Group
")


