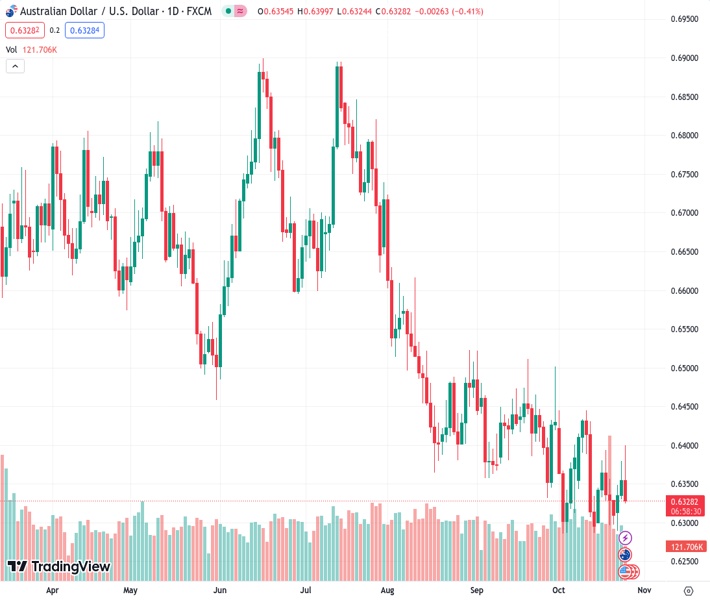
#AUDUSD @ 0.63295 found an intense sell-off near 0.6400 after a sticky Australian inflation report.
…
This is a premium post.
[s2If !current_user_can(access_s2member_level4)]Please register for FREE REGISTER to read full post below containing analysis. In case of any error or you think you are not able to read the full post below, please email us at support#nehcap.com [lwa][/s2If] [s2If current_user_can(access_s2member_level1)]
- AUD/USD found an intense sell-off near 0.6400 after a sticky Australian inflation report.
The pair currently trades last at 0.63295.
The previous day high was 0.6379 while the previous day low was 0.6333. The daily 38.2% Fib levels comes at 0.6361, expected to provide resistance. Similarly, the daily 61.8% fib level is at 0.635, expected to provide resistance.
The AUD/USD pair falls sharply after facing tough barricades near the round-level resistance of 0.6400. The Aussie asset faced a sell-off after the release of the sticky Australian Consumer Price Index (CPI) report for the July-September quarter.
The Australian Bureau of Statistics reported that consumer inflation grew at a higher pace of 1.2% in the third quarter against expectations of 1.1% and 0.8% reading in the April-June quarter. The annual inflation rose by 5.4% against the consensus of 5.3% but slowed from the former reading of 6.0%.
A sticky Australian inflation report has prompted expectations of one more 25 basis points (bps) interest rate hike from the Reserve Bank of Australia (RBA), which would push the Official Cash Rate (OCR) to 4.35%.
The US Dollar strengthens on expectations that recovering US factory activities could escalate hawkish Federal Reserve (Fed) bets.
AUD/USD trades in a Falling Channel chart pattern on a four-hour scale in which each pullback is considered as a selling opportunity by the market participants. The 200-period Exponential Moving Average (EMA) is sloping downside, which indicates that the broader trend is bearish. Major support is plotted from October 3 low at 0.6287.
The Relative Strength Index (RSI) (14) trades in the 40.00-60.000, indicating a consolidation ahead of crucial US economic readings.
A fresh downside would appear if the Aussie asset drops below October 03 low around 0.6286. This would expose the asset to 21 October 2022 low at 0.6212, followed by 13 October 2022 low at 0.6170.
In an alternate scenario, a decisive break above August 15 high around 0.6522 will drive the asset to August 9 high at 0.6571. Breach of the latter will drive the asset towards August 10 high at 0.6616.
Technical Levels: Supports and Resistances
AUDUSD currently trading at 0.6328 at the time of writing. Pair opened at 0.6355 and is trading with a change of -0.42 % .
| Overview | Overview.1 | |
|---|---|---|
| 0 | Today last price | 0.6328 |
| 1 | Today Daily Change | -0.0027 |
| 2 | Today Daily Change % | -0.4200 |
| 3 | Today daily open | 0.6355 |
The pair remains strongly bearish on the daily time frame. It trades below the 20 SMA @ 0.636, 50 SMA 0.6401, 100 SMA @ 0.6547 and 200 SMA @ 0.6648.
| Trends | Trends.1 | |
|---|---|---|
| 0 | Daily SMA20 | 0.6360 |
| 1 | Daily SMA50 | 0.6401 |
| 2 | Daily SMA100 | 0.6547 |
| 3 | Daily SMA200 | 0.6648 |
The previous day high was 0.6379 while the previous day low was 0.6333. The daily 38.2% Fib levels comes at 0.6361, expected to provide resistance. Similarly, the daily 61.8% fib level is at 0.635, expected to provide resistance.
Note the levels of interest below:
- Pivot support is noted at 0.6332, 0.6309, 0.6286
- Pivot resistance is noted at 0.6378, 0.6402, 0.6425
| Levels | Levels.1 |
|---|---|
| Previous Daily High | 0.6379 |
| Previous Daily Low | 0.6333 |
| Previous Weekly High | 0.6393 |
| Previous Weekly Low | 0.6296 |
| Previous Monthly High | 0.6522 |
| Previous Monthly Low | 0.6332 |
| Daily Fibonacci 38.2% | 0.6361 |
| Daily Fibonacci 61.8% | 0.6350 |
| Daily Pivot Point S1 | 0.6332 |
| Daily Pivot Point S2 | 0.6309 |
| Daily Pivot Point S3 | 0.6286 |
| Daily Pivot Point R1 | 0.6378 |
| Daily Pivot Point R2 | 0.6402 |
| Daily Pivot Point R3 | 0.6425 |
[/s2If]
Download Nehcap EAWe have two EAs that are operational on our LIVE accounts.
- EA-FIX: Check out the details here. Download EA-FIX . EA-FIX is a non-grid HFT scalper.
- EA-GROWTH: High quality low dd EA using trend grids. Download EA_GROWTHJoin Our Telegram Group
")


