#USDMXN @ 18.1282 extends losses for a third day on the downbeat US Dollar.
…
This is a premium post.
[s2If !current_user_can(access_s2member_level4)]Please register for FREE REGISTER to read full post below containing analysis. In case of any error or you think you are not able to read the full post below, please email us at support#nehcap.com [lwa][/s2If] [s2If current_user_can(access_s2member_level1)]
- USD/MXN extends losses for a third day on the downbeat US Dollar.
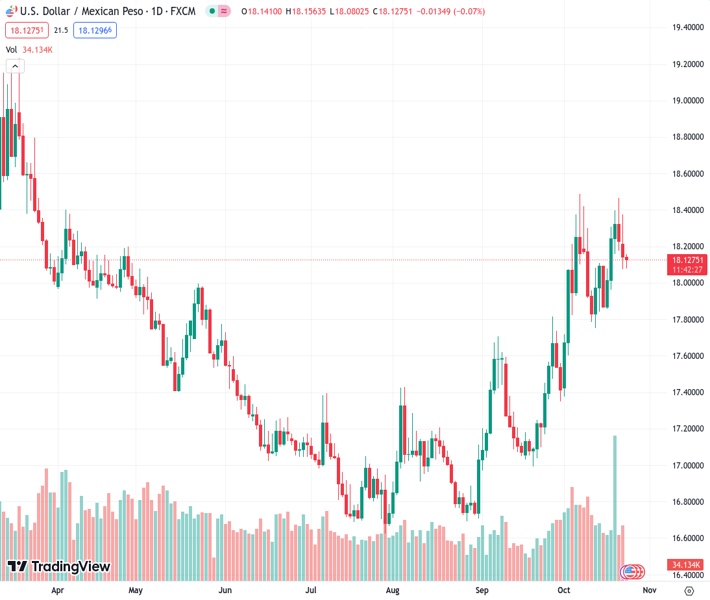
The pair currently trades last at 18.1282.
The previous day high was 18.3755 while the previous day low was 18.0768. The daily 38.2% Fib levels comes at 18.1909, expected to provide resistance. Similarly, the daily 61.8% fib level is at 18.2614, expected to provide resistance.
USD/MXN follows the downward trajectory, trading lower near 18.1250 during the European session on Tuesday. The pair encounters hurdles stemming from a correction in the US Dollar (USD) along with a prevailing risk-on sentiment in the market.
The Mexican Peso (MXN) faced pressure as a result of disappointing retail sales in Mexico. The sharp 0.4% month-on-month decline in August, falling below the expected 0.0%, and the annual growth of 3.2%, which was lower than the forecasted 4.4% and July’s 5.1%, are contributing factors.
In the previous week, Deputy Governor Omar Mejia of the Bank of Mexico (Banxico) maintained that the balance of inflation risks hasn’t worsened. He highlighted the effectiveness of the current restrictive monetary policy in managing inflation and anticipates it aligning with Banxico’s target by the second quarter of 2025.
Investors feel unsettled due to the possibility of an escalation in the Middle East, which could lead to disruptions in the region. Within Israel, there is a demand to reconsider the expected scope of a ground invasion of Gaza in the near future. However, diplomatic efforts are underway to ease tensions in the Israel-Hamas Gaza Strip.
China’s announcement of plans to issue slightly over 1 trillion yuan in additional sovereign debt appears to be influencing market sentiment positively. Furthermore, the constructive dialogues between the US and China during their initial economic working group meeting reinforced this optimistic outlook. Consequently, the safe-haven US Dollar is experiencing downward pressure, impacting the USD/MXN pair.
The US Dollar Index (DXY) struggles to halt the losing streak, hovering around 105.70. After peaking at 5.02%, the 10-year Treasury yield swiftly reversed course, dropping to 4.81% in the latest update.
Investors await the US S&P Global PMI on Tuesday, followed by close attention to Q3 Gross Domestic Product (GDP) figures on Thursday. Additionally, Mexico’s Trade Balance data is set to be released on Friday.
Technical Levels: Supports and Resistances
USDMXN currently trading at 18.1181 at the time of writing. Pair opened at 18.1544 and is trading with a change of -0.2 % .
| Overview | Overview.1 | |
|---|---|---|
| 0 | Today last price | 18.1181 |
| 1 | Today Daily Change | -0.0363 |
| 2 | Today Daily Change % | -0.2000 |
| 3 | Today daily open | 18.1544 |
The pair remains strongly bullish on the daily timeframe. It trades above its 20 SMA @ 17.9623, 50 SMA 17.4562, 100 SMA @ 17.2519 and 200 SMA @ 17.7469.
| Trends | Trends.1 | |
|---|---|---|
| 0 | Daily SMA20 | 17.9623 |
| 1 | Daily SMA50 | 17.4562 |
| 2 | Daily SMA100 | 17.2519 |
| 3 | Daily SMA200 | 17.7469 |
The previous day high was 18.3755 while the previous day low was 18.0768. The daily 38.2% Fib levels comes at 18.1909, expected to provide resistance. Similarly, the daily 61.8% fib level is at 18.2614, expected to provide resistance.
Note the levels of interest below:
- Pivot support is noted at 18.029, 17.9036, 17.7303
- Pivot resistance is noted at 18.3277, 18.5009, 18.6264
| Levels | Levels.1 |
|---|---|
| Previous Daily High | 18.3755 |
| Previous Daily Low | 18.0768 |
| Previous Weekly High | 18.4672 |
| Previous Weekly Low | 17.8719 |
| Previous Monthly High | 17.8174 |
| Previous Monthly Low | 16.9727 |
| Daily Fibonacci 38.2% | 18.1909 |
| Daily Fibonacci 61.8% | 18.2614 |
| Daily Pivot Point S1 | 18.0290 |
| Daily Pivot Point S2 | 17.9036 |
| Daily Pivot Point S3 | 17.7303 |
| Daily Pivot Point R1 | 18.3277 |
| Daily Pivot Point R2 | 18.5009 |
| Daily Pivot Point R3 | 18.6264 |
[/s2If]
Download Nehcap EAWe have two EAs that are operational on our LIVE accounts.
- EA-FIX: Check out the details here. Download EA-FIX . EA-FIX is a non-grid HFT scalper.
- EA-GROWTH: High quality low dd EA using trend grids. Download EA_GROWTHJoin Our Telegram Group
")


