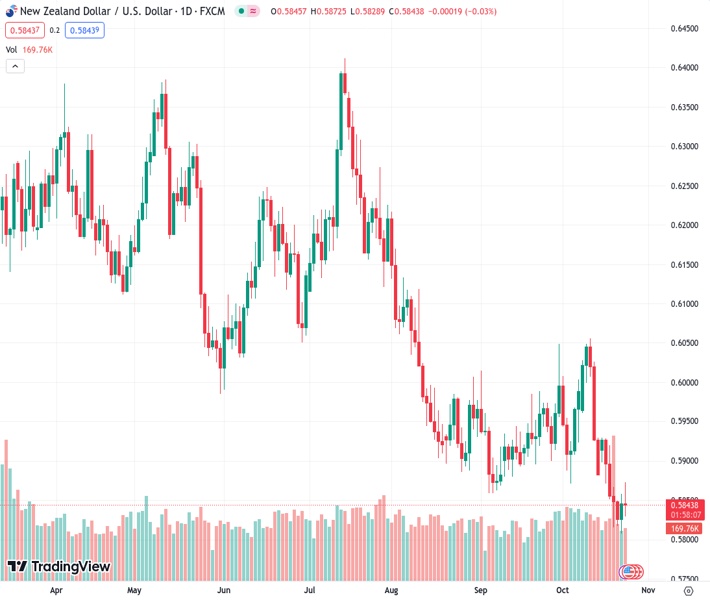
#NZDUSD @ 0.58407 The retreated from a high of 0.5870 to 0.5840.
…
This is a premium post.
[s2If !current_user_can(access_s2member_level4)]Please register for FREE REGISTER to read full post below containing analysis. In case of any error or you think you are not able to read the full post below, please email us at support#nehcap.com [lwa][/s2If] [s2If current_user_can(access_s2member_level1)]
- The NZD/USD retreated from a high of 0.5870 to 0.5840.
The pair currently trades last at 0.58407.
The previous day high was 0.5859 while the previous day low was 0.5807. The daily 38.2% Fib levels comes at 0.5839, expected to provide support. Similarly, the daily 61.8% fib level is at 0.5827, expected to provide support.
On Tuesday, the NZD/USD failed to hold its momentum, which saw the pair rising to 0.5870 and then settling at 0.5840 trading with mild losses. Following the release of strong Manufacturing and Services PMIs the US Dollar gained interest as its economy is holding strong. In addition, US Treasury yields are rising, benefiting the green currency.
The S&P Global revealed that the S&P Global Manufacturing PMI from October came in above the consensus. The headline figure came in at 50, above the consensus of 49.5 and rose from its previous figure of 49.8. Likewise, the Services PMI is at 50.9, above the expected 49.8 and rose from its previous figure of 50.1.
As a reaction, the USD, measured by the DXY index, recovered from a low of around 105.35 and rose above 106.00. Furthermore, the 2,5 and 10-year yields increased to 5.12%,4.84% and 4.87% respectively. That said, the green currency’s upside is limited by markets betting on a less aggressive Federal Reserve (Fed) after Chair Powell’s speech last week. He highlighted that the high bond yields will be considered and that the bank will proceed “carefully”. As for now, according to the CME FedWatch tool, the odds of a 25 bps hike in the December meeting remain low and stand around 25%, while investors have practically priced in a pause in November.
For further guidance, markets await Q3 Gross Domestic Product (GDP) data on Thursday and Personal Consumption Expenditures (PCE) figures from September on Friday. In addition, Jerome Powell will be on the wires on Wednesday. It is worth noticing that last week, the USD faced selling pressure after the Fed Chair’s speech, where he pointed out that higher yields will be taken into account in the next decisions and that the bank will proceed “carefully”.
Considering the daily chart, the NZD/USD shows a bearish outlook for the short term.
The Relative Strength Index (RSI), positioned below its midline in negative territory with a southward slope, supports this view along with the negative indication from the Moving Average Convergence Divergence (MACD), which is displaying red bars, pointing towards a strengthening bearish trend. Also, the pair is below the 20,100 and 200-day Simple Moving Averages (SMAs),indicating that on the broader picture, the bears are in command, and that the buyers have some work to do.
Support levels: 0.5820,0.5800,0.5770.
Resistance levels: 0.5890,0.5900,0.5930 (200-day SMA).
Technical Levels: Supports and Resistances
NZDUSD currently trading at 0.5843 at the time of writing. Pair opened at 0.5846 and is trading with a change of -0.05 % .
| Overview | Overview.1 | |
|---|---|---|
| 0 | Today last price | 0.5843 |
| 1 | Today Daily Change | -0.0003 |
| 2 | Today Daily Change % | -0.0500 |
| 3 | Today daily open | 0.5846 |
The pair remains strongly bearish on the daily time frame. It trades below the 20 SMA @ 0.5933, 50 SMA 0.5929, 100 SMA @ 0.6046 and 200 SMA @ 0.6147.
| Trends | Trends.1 | |
|---|---|---|
| 0 | Daily SMA20 | 0.5933 |
| 1 | Daily SMA50 | 0.5929 |
| 2 | Daily SMA100 | 0.6046 |
| 3 | Daily SMA200 | 0.6147 |
The previous day high was 0.5859 while the previous day low was 0.5807. The daily 38.2% Fib levels comes at 0.5839, expected to provide support. Similarly, the daily 61.8% fib level is at 0.5827, expected to provide support.
Note the levels of interest below:
- Pivot support is noted at 0.5815, 0.5785, 0.5763
- Pivot resistance is noted at 0.5867, 0.5889, 0.5919
| Levels | Levels.1 |
|---|---|
| Previous Daily High | 0.5859 |
| Previous Daily Low | 0.5807 |
| Previous Weekly High | 0.5931 |
| Previous Weekly Low | 0.5815 |
| Previous Monthly High | 0.6050 |
| Previous Monthly Low | 0.5847 |
| Daily Fibonacci 38.2% | 0.5839 |
| Daily Fibonacci 61.8% | 0.5827 |
| Daily Pivot Point S1 | 0.5815 |
| Daily Pivot Point S2 | 0.5785 |
| Daily Pivot Point S3 | 0.5763 |
| Daily Pivot Point R1 | 0.5867 |
| Daily Pivot Point R2 | 0.5889 |
| Daily Pivot Point R3 | 0.5919 |
[/s2If]
Download Nehcap EAWe have two EAs that are operational on our LIVE accounts.
- EA-FIX: Check out the details here. Download EA-FIX . EA-FIX is a non-grid HFT scalper.
- EA-GROWTH: High quality low dd EA using trend grids. Download EA_GROWTHJoin Our Telegram Group
")


