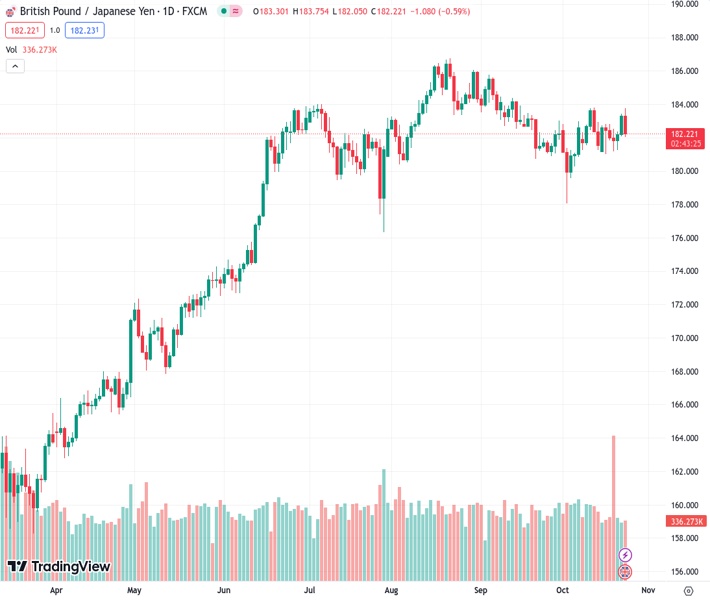
#GBPJPY @ 182.223 The is seeing a rapid decline back into near-term consolidation after a miss for the UK Composite PMI.
…
This is a premium post.
[s2If !current_user_can(access_s2member_level4)]Please register for FREE REGISTER to read full post below containing analysis. In case of any error or you think you are not able to read the full post below, please email us at support#nehcap.com [lwa][/s2If] [s2If current_user_can(access_s2member_level1)]
- The GBP/JPY is seeing a rapid decline back into near-term consolidation after a miss for the UK Composite PMI.
The pair currently trades last at 182.223.
The previous day high was 183.43 while the previous day low was 182.09. The daily 38.2% Fib levels comes at 182.92, expected to provide resistance. Similarly, the daily 61.8% fib level is at 182.6, expected to provide resistance.
The GBP/JPY is down around 150 pips from Tuesday’s early peak at 183.75, sliding 0.9% on the day as the Pound Sterling (GBP) pares away all of Monday’s gains for the early week against the Japanese Yen (JPY).
The GBP has waffled its market stance after a miss for UK Purchasing Manager Index (PMI) figures on Tuesday.
UK Preliminary Services PMI inches lower to 49.2 in October vs. 49.5 expected
The UK’s PMI reading on Tuesday exposed the Pound Sterling to the downside after missing expectations in the headline figure, with the Composite PMI printing at 48.6 for October, a minor improvement from September’s 48.5 but missing Wall Street’s forecast 48.8.
The UK Manufacturing PMI beat expectations slightly, coming in at 45.2 against the expected 45, improving markedly over the previous month’s 44.3, but the Services component of the UK PMI reading failed to spark confidence after an unexpected downtick from 49.3 to 49.2, missing the expected increase into 49.5.
With the GBP floundering following the missed forward-looking growth measure, GGBP/JPY traders will be looking ahead to Japan’s Tokyo Consumer Price Index (CPI) inflation reading due early in the Asia Friday market session.
The annualized Tokyo CPI last came in at 2.8% for September, and markets are forecasting the Tokyo Core CPI (CPI inflation minus volatile fresh food prices) to hold steady at 2.5%; a miss for the indicator will make it increasingly difficult for the Bank of Japan (BoJ) to look ahead to ending their negative rate regime with inflation broadly expected to decline below the Japanese central bank’s lower target band of 2%.
The Pound Sterling has shed 0.9% against the Yen on Tuesday, tumbling from an eight-day high of 183.75 as the GBP/JPY starts to treat the 50-day Simple Moving Average (SMA) as a price ceiling on the charts.
As the daily candlesticks continue to churn, chances for a firm bullish break are evaporating, and the Guppy is looking poised for possible declines back towards the 200-day SMA currently rising into the 174.00 handle.
A topside break will need to reclaim the 186.00 psychological level before gearing up for another run at 2023’s highs beyond 186.77 set back in August.
Technical Levels: Supports and Resistances
GBPJPY currently trading at 182.31 at the time of writing. Pair opened at 183.38 and is trading with a change of -0.58 % .
| Overview | Overview.1 | |
|---|---|---|
| 0 | Today last price | 182.31 |
| 1 | Today Daily Change | -1.07 |
| 2 | Today Daily Change % | -0.58 |
| 3 | Today daily open | 183.38 |
The pair is trading above its 20 Daily moving average @ 182.0, below its 50 Daily moving average @ 183.3 , above its 100 Daily moving average @ 182.19 and above its 200 Daily moving average @ 173.57
| Trends | Trends.1 | |
|---|---|---|
| 0 | Daily SMA20 | 182.00 |
| 1 | Daily SMA50 | 183.30 |
| 2 | Daily SMA100 | 182.19 |
| 3 | Daily SMA200 | 173.57 |
The previous day high was 183.43 while the previous day low was 182.09. The daily 38.2% Fib levels comes at 182.92, expected to provide resistance. Similarly, the daily 61.8% fib level is at 182.6, expected to provide resistance.
Note the levels of interest below:
- Pivot support is noted at 182.5, 181.62, 181.16
- Pivot resistance is noted at 183.85, 184.31, 185.19
| Levels | Levels.1 |
|---|---|
| Previous Daily High | 183.43 |
| Previous Daily Low | 182.09 |
| Previous Weekly High | 182.81 |
| Previous Weekly Low | 181.02 |
| Previous Monthly High | 185.78 |
| Previous Monthly Low | 180.82 |
| Daily Fibonacci 38.2% | 182.92 |
| Daily Fibonacci 61.8% | 182.60 |
| Daily Pivot Point S1 | 182.50 |
| Daily Pivot Point S2 | 181.62 |
| Daily Pivot Point S3 | 181.16 |
| Daily Pivot Point R1 | 183.85 |
| Daily Pivot Point R2 | 184.31 |
| Daily Pivot Point R3 | 185.19 |
[/s2If]
Download Nehcap EAWe have two EAs that are operational on our LIVE accounts.
- EA-FIX: Check out the details here. Download EA-FIX . EA-FIX is a non-grid HFT scalper.
- EA-GROWTH: High quality low dd EA using trend grids. Download EA_GROWTHJoin Our Telegram Group
")


