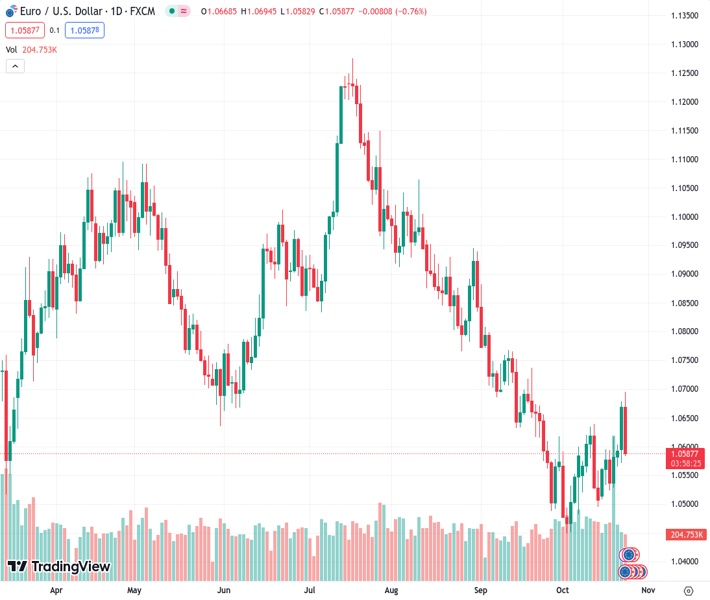
#EURUSD @ 1.05850 reverses course at 50-DMA, sliding below 1.0600 as US Treasury bond yields rise.
…
This is a premium post.
[s2If !current_user_can(access_s2member_level4)]Please register for FREE REGISTER to read full post below containing analysis. In case of any error or you think you are not able to read the full post below, please email us at support#nehcap.com [lwa][/s2If] [s2If current_user_can(access_s2member_level1)]
- EUR/USD reverses course at 50-DMA, sliding below 1.0600 as US Treasury bond yields rise.
The pair currently trades last at 1.05850.
The previous day high was 1.0678 while the previous day low was 1.0572. The daily 38.2% Fib levels comes at 1.0637, expected to provide resistance. Similarly, the daily 61.8% fib level is at 1.0612, expected to provide resistance.
EUR/USD reverses its course at the 50-day moving average (DMA) and slides below the 1.0600 psychological level as Treasury bond yields in the United States (US) rise following business activity data. At the time of writing, the EUR/USD is trading at 1.0591 after hitting a high of 1.0694, down 0.72%.
The US economy continues to gather momentum, as revealed by S&P Global, as business activity picked up, according to the latest Purchasing Management Index (PMI) reports. S&P Global Manufacturing PMI expanded by 50, exceeding the forecast of 49.5, while the Services component stood at 50.9, above the projected 49.8. Consequently, the S&P Global Composite PMI was above the prior’s 50.2 figure at 51.
Consequently, US Treasury bond yields advanced to 4.88% as a reaction to the data, underpinning the Greenback as shown by the US Dollar Index (DXY), gaining 0.64%, up at 106.27. Therefore, the EUR/USD extended its losses past the 1.0600 figure.
On the Eurozone (EU) front, the calendar revealed that business conditions continued deteriorating. Manufacturing, Services, and Composite PMIs, revealed by S&P Global, remained at recessionary territory, below forecasts and the previous month’s data. That and Germany’s GfK Consumer Confidence plunging weighed on the Euro (EUR), which fell off the cliff after hitting a daily high shy of 1.0700.
Ahead of the week, the European Central Bank (ECB) is expected to hold rates unchanged, though it is projected to leave the door open for further hikes if needed.
The EUR/USD remains downward biased, although upward corrected shy of reclaiming the 1.0700 mark. As the fundamental picture deteriorates in the EU, further downside is expected. First, support is seen at the October 23 low of 1.0571, followed by the previous cycle low of 1.0495, slightly below the 1.0500 mark. Once those two areas are cleared, the next stop would be the year-to-date (YTD) low of 1.0448. On the other hand, if EUR/USD stays above 1.0600, that could open the door to test the October 12 high of 1.0639 before challenging 1.0700.
Technical Levels: Supports and Resistances
EURUSD currently trading at 1.0599 at the time of writing. Pair opened at 1.067 and is trading with a change of -0.67 % .
| Overview | Overview.1 | |
|---|---|---|
| 0 | Today last price | 1.0599 |
| 1 | Today Daily Change | -0.0071 |
| 2 | Today Daily Change % | -0.6700 |
| 3 | Today daily open | 1.0670 |
The pair is trading above its 20 Daily moving average @ 1.0557, below its 50 Daily moving average @ 1.0685 , below its 100 Daily moving average @ 1.0825 and below its 200 Daily moving average @ 1.0819
| Trends | Trends.1 | |
|---|---|---|
| 0 | Daily SMA20 | 1.0557 |
| 1 | Daily SMA50 | 1.0685 |
| 2 | Daily SMA100 | 1.0825 |
| 3 | Daily SMA200 | 1.0819 |
The previous day high was 1.0678 while the previous day low was 1.0572. The daily 38.2% Fib levels comes at 1.0637, expected to provide resistance. Similarly, the daily 61.8% fib level is at 1.0612, expected to provide resistance.
Note the levels of interest below:
- Pivot support is noted at 1.0602, 1.0533, 1.0495
- Pivot resistance is noted at 1.0708, 1.0746, 1.0815
| Levels | Levels.1 |
|---|---|
| Previous Daily High | 1.0678 |
| Previous Daily Low | 1.0572 |
| Previous Weekly High | 1.0617 |
| Previous Weekly Low | 1.0511 |
| Previous Monthly High | 1.0882 |
| Previous Monthly Low | 1.0488 |
| Daily Fibonacci 38.2% | 1.0637 |
| Daily Fibonacci 61.8% | 1.0612 |
| Daily Pivot Point S1 | 1.0602 |
| Daily Pivot Point S2 | 1.0533 |
| Daily Pivot Point S3 | 1.0495 |
| Daily Pivot Point R1 | 1.0708 |
| Daily Pivot Point R2 | 1.0746 |
| Daily Pivot Point R3 | 1.0815 |
[/s2If]
Download Nehcap EAWe have two EAs that are operational on our LIVE accounts.
- EA-FIX: Check out the details here. Download EA-FIX . EA-FIX is a non-grid HFT scalper.
- EA-GROWTH: High quality low dd EA using trend grids. Download EA_GROWTHJoin Our Telegram Group
")


