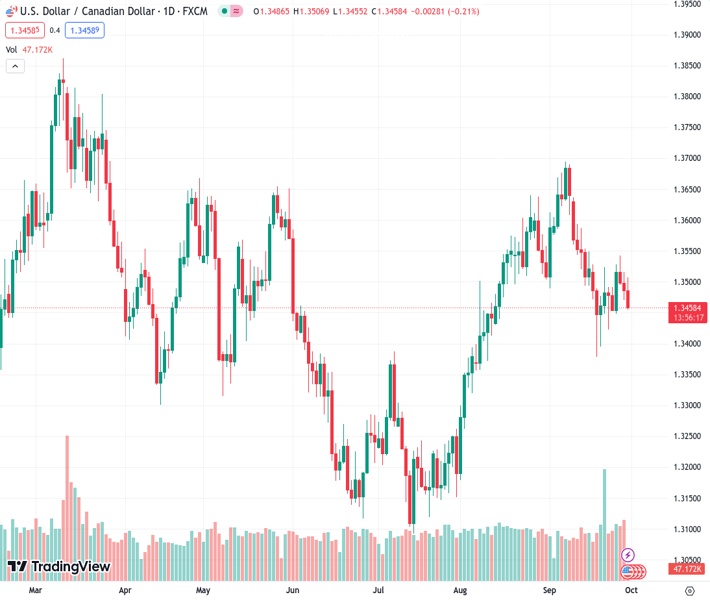
The USDCAD currency pair, which was trading at 1.34552, is facing difficulties gaining momentum near the 1.3458 level due to the weaker US dollar.
…
This is a premium post.
[s2If !current_user_can(access_s2member_level4)]Please register for FREE REGISTER to read full post below containing analysis. In case of any error or you think you are not able to read the full post below, please email us at support#nehcap.com [lwa][/s2If] [s2If current_user_can(access_s2member_level1)]
- USD/CAD loses traction near 1.3458 amid the weaker USD.
The pair currently trades last at 1.34552.
The previous day high was 1.3516 while the previous day low was 1.347. The daily 38.2% Fib levels comes at 1.3488, expected to provide resistance. Similarly, the daily 61.8% fib level is at 1.3499, expected to provide resistance.
The USD/CAD pair attracts some sellers around 1.3458 during the early European session on Friday. The downtick of the pair is supported by a correction of the US Dollar (USD) and lower US Treasury yields. Meanwhile, the US Dollar Index (DXY) drops to 105.90 after retreating from 106.83, the highest since November.
From the technical perspective, USD/CAD holds below the 50- and 100-hour Exponential Moving Averages (EMAs) on the four-hour chart, which supports the sellers for the time being. Meanwhile, the Relative Strength Index (RSI) is located in the bearish territory below 50, which means the path of the least resistance of USD/CAD is to the downside.
The immediate resistance level for the pair is seen near the 50-hour EMA at 1.3495. The additional upside filter to watch is near the 100-hour EMA at 1.3510. Further north, the pair will see a rally to the upper boundary of the Bollinger Band of 1.3536. Any follow-through buying above the latter will pave the way to a high of September 13 at 1.3586, followed by a psychological round figure at 1.3600.
On the downside, any decisive break below the lower limit of the Bollinger Band of 1.3465 will see a drop to the next contention at 1.3423 (a low of September 22). Further south, the next downside stop will emerge at 1.3380 (a low of September 19) en route to a low of August 4 at 1.3319.
Technical Levels: Supports and Resistances
USDCAD currently trading at 1.3462 at the time of writing. Pair opened at 1.3487 and is trading with a change of -0.19 % .
| Overview | Overview.1 | |
|---|---|---|
| 0 | Today last price | 1.3462 |
| 1 | Today Daily Change | -0.0025 |
| 2 | Today Daily Change % | -0.1900 |
| 3 | Today daily open | 1.3487 |
The pair is trading below its 20 Daily moving average @ 1.3541, below its 50 Daily moving average @ 1.3466 , above its 100 Daily moving average @ 1.3403 and above its 200 Daily moving average @ 1.3459
| Trends | Trends.1 | |
|---|---|---|
| 0 | Daily SMA20 | 1.3541 |
| 1 | Daily SMA50 | 1.3466 |
| 2 | Daily SMA100 | 1.3403 |
| 3 | Daily SMA200 | 1.3459 |
The previous day high was 1.3516 while the previous day low was 1.347. The daily 38.2% Fib levels comes at 1.3488, expected to provide resistance. Similarly, the daily 61.8% fib level is at 1.3499, expected to provide resistance.
Note the levels of interest below:
- Pivot support is noted at 1.3466, 1.3445, 1.342
- Pivot resistance is noted at 1.3512, 1.3537, 1.3558
| Levels | Levels.1 |
|---|---|
| Previous Daily High | 1.3516 |
| Previous Daily Low | 1.3470 |
| Previous Weekly High | 1.3528 |
| Previous Weekly Low | 1.3379 |
| Previous Monthly High | 1.3640 |
| Previous Monthly Low | 1.3184 |
| Daily Fibonacci 38.2% | 1.3488 |
| Daily Fibonacci 61.8% | 1.3499 |
| Daily Pivot Point S1 | 1.3466 |
| Daily Pivot Point S2 | 1.3445 |
| Daily Pivot Point S3 | 1.3420 |
| Daily Pivot Point R1 | 1.3512 |
| Daily Pivot Point R2 | 1.3537 |
| Daily Pivot Point R3 | 1.3558 |
[/s2If]
Download Nehcap EAWe have two EAs that are operational on our LIVE accounts.
- EA-FIX: Check out the details here. Download EA-FIX . EA-FIX is a non-grid HFT scalper.
- EA-GROWTH: High quality low dd EA using trend grids. Download EA_GROWTHJoin Our Telegram Group
")


