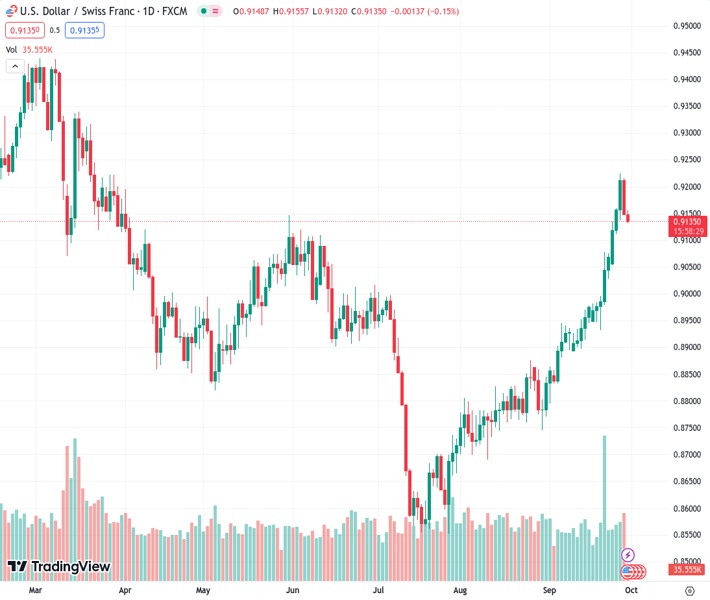
The USD/CHF pair retreats from its peak levels since March, currently standing at 0.91357.
…
This is a premium post.
[s2If !current_user_can(access_s2member_level4)]Please register for FREE REGISTER to read full post below containing analysis. In case of any error or you think you are not able to read the full post below, please email us at support#nehcap.com [lwa][/s2If] [s2If current_user_can(access_s2member_level1)]
- USD/CHF pulls back from the highest levels since March.
The pair currently trades last at 0.91357.
The previous day high was 0.9217 while the previous day low was 0.9147. The daily 38.2% Fib levels comes at 0.9174, expected to provide resistance. Similarly, the daily 61.8% fib level is at 0.919, expected to provide resistance.
USD/CHF continues to retrace the gains for the second consecutive day post ending a winning streak that began on September 19. The spot price trades around 0.9130 during the Asian session on Friday. The USD/CHF pair is under pressure after the moderate economic data from the United States (US).
US GDP kept consistent at 2.1% as expected. Initial Jobless Claims for the week ending on September 22, improved to 204K from the 202K prior, falling short of the 215K expected.
US Pending Home Sales showed a decline of 7.1%, exceeding the market expectation of a 0.8% fall, swinging from the 0.9% rise previously.
The US Dollar Index (DXY) extends losses on the second day after the moderate datasets from the United States (US), trading lower around 106.00 by the press time. However, the improved US yields could put a cap on the losses of the US Dollar (USD).
The yield on the 10-year US Treasury bond retraces the recent losses, standing at 4.60% at the time of writing.
Chicago Fed President Austan Goolsbee expressed confidence that the Fed will bring inflation back to its target. Goolsbee also emphasized the unique chance to achieve this without a recession, indicating the US Federal Reserve’s (Fed) commitment to managing inflation while sustaining economic growth.
Richmond Fed President Thomas Barkin stated that recent inflation data has been positive but highlighted that it’s too early to predict the future course of monetary policy.
Traders await the US Core Personal Consumption Expenditure (PCE) Price Index, the Fed’s preferred measure of consumer inflation, which is due on Friday. The annual rate is expected to reduce from 4.2% to 3.9%.
On the Swiss front, investors will likely watch Real Retail Sales for August to be released later in the day.
The Swiss Franc (CHF) is experiencing upward support, which could be attributed to a recent analysis by economists at ANZ Bank. Their analysis has highlighted that the CHF has become the top-performing currency among the G10 currencies in relation to the Greenback.
Technical Levels: Supports and Resistances
USDCHF currently trading at 0.9133 at the time of writing. Pair opened at 0.915 and is trading with a change of -0.19 % .
| Overview | Overview.1 | |
|---|---|---|
| 0 | Today last price | 0.9133 |
| 1 | Today Daily Change | -0.0017 |
| 2 | Today Daily Change % | -0.1900 |
| 3 | Today daily open | 0.9150 |
The pair remains strongly bullish on the daily timeframe. It trades above its 20 SMA @ 0.8987, 50 SMA 0.885, 100 SMA @ 0.8896 and 200 SMA @ 0.9032.
| Trends | Trends.1 | |
|---|---|---|
| 0 | Daily SMA20 | 0.8987 |
| 1 | Daily SMA50 | 0.8850 |
| 2 | Daily SMA100 | 0.8896 |
| 3 | Daily SMA200 | 0.9032 |
The previous day high was 0.9217 while the previous day low was 0.9147. The daily 38.2% Fib levels comes at 0.9174, expected to provide resistance. Similarly, the daily 61.8% fib level is at 0.919, expected to provide resistance.
Note the levels of interest below:
- Pivot support is noted at 0.9126, 0.9102, 0.9056
- Pivot resistance is noted at 0.9196, 0.9241, 0.9265
| Levels | Levels.1 |
|---|---|
| Previous Daily High | 0.9217 |
| Previous Daily Low | 0.9147 |
| Previous Weekly High | 0.9078 |
| Previous Weekly Low | 0.8932 |
| Previous Monthly High | 0.8876 |
| Previous Monthly Low | 0.8690 |
| Daily Fibonacci 38.2% | 0.9174 |
| Daily Fibonacci 61.8% | 0.9190 |
| Daily Pivot Point S1 | 0.9126 |
| Daily Pivot Point S2 | 0.9102 |
| Daily Pivot Point S3 | 0.9056 |
| Daily Pivot Point R1 | 0.9196 |
| Daily Pivot Point R2 | 0.9241 |
| Daily Pivot Point R3 | 0.9265 |
[/s2If]
Download Nehcap EAWe have two EAs that are operational on our LIVE accounts.
- EA-FIX: Check out the details here. Download EA-FIX . EA-FIX is a non-grid HFT scalper.
- EA-GROWTH: High quality low dd EA using trend grids. Download EA_GROWTHJoin Our Telegram Group
")


