The US dollar’s negative performance causes the USDMXN currency pair to bounce back after a period of consecutive gains.
…
This is a premium post.
[s2If !current_user_can(access_s2member_level4)]Please register for FREE REGISTER to read full post below containing analysis. In case of any error or you think you are not able to read the full post below, please email us at support#nehcap.com [lwa][/s2If] [s2If current_user_can(access_s2member_level1)]
- USD/MXN recovers from the winning streak on the back of the downbeat US Dollar.
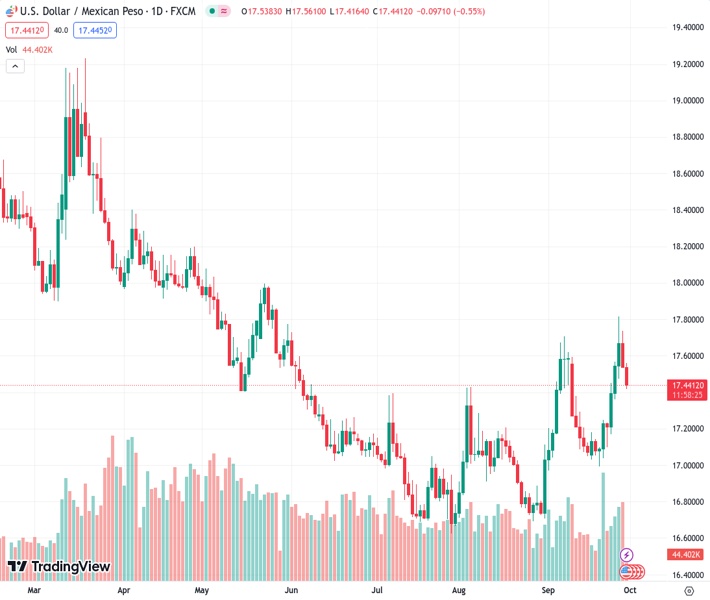
The pair currently trades last at 17.4339.
The previous day high was 17.7387 while the previous day low was 17.5392. The daily 38.2% Fib levels comes at 17.6155, expected to provide resistance. Similarly, the daily 61.8% fib level is at 17.6625, expected to provide resistance.
USD/MXN retraces the winning streak that began on Monday, trading lower around 17.4480 during the European session on Friday. The pair faces downward pressure due to the correction in the US Dollar (USD).
The US Dollar Index (DXY) continues to weaken, which could be attributed to the pullback in US Treasury yields. The spot price bids lower around 105.80. The yield on the 10-year US Treasury bond stands at 4.54% by the press time.
The US Gross Domestic Product (GDP) remained steady at 2.1%, aligning with expectations. Initial Jobless Claims for the week ending on September 22 improved to 204K, a slight decrease from the previous 202K but fell short of the anticipated 215K.
US Pending Home Sales recorded a notable decline of 7.1%, surpassing the market expectation of a 0.8% fall. This decline contrasts with the previous 0.9% rise and highlights a significant swing in the housing market.
Chicago Fed President Austan Goolsbee has expressed confidence in the Federal Reserve’s (Fed) ability to bring inflation back to its target. Goolsbee emphasized the unique opportunity to achieve this without a recession, underscoring the Fed’s commitment to managing inflation while sustaining economic growth.
Richmond Fed President Thomas Barkin acknowledged that recent inflation data has been positive but cautioned that it is too early to predict the future course of monetary policy.
Traders await the release of the US Core Personal Consumption Expenditure (PCE) Price Index, the Fed’s preferred measure of consumer inflation, scheduled for Friday. The anticipated reduction in the annual rate from 4.2% to 3.9% will be closely watched by market participants for its potential impact on the US Dollar.
On Mexico’s side, the Mexican Peso (MXN) received upward support as the Banco de México (Banxico) maintained its restrictive monetary policy stance in Thursday’s meeting.
Mexico’s central bank kept interest rates unchanged at 11.25%, following the upward revision of its inflation forecasts. However, Mexico’s Jobless Rate (MoM) for August edged lower from 3.1% in July to 3.0%.
Technical Levels: Supports and Resistances
USDMXN currently trading at 17.448 at the time of writing. Pair opened at 17.5418 and is trading with a change of -0.53 % .
| Overview | Overview.1 | |
|---|---|---|
| 0 | Today last price | 17.4480 |
| 1 | Today Daily Change | -0.0938 |
| 2 | Today Daily Change % | -0.5300 |
| 3 | Today daily open | 17.5418 |
The pair is trading above its 20 Daily moving average @ 17.31, above its 50 Daily moving average @ 17.0995 , above its 100 Daily moving average @ 17.1902 and below its 200 Daily moving average @ 17.8489
| Trends | Trends.1 | |
|---|---|---|
| 0 | Daily SMA20 | 17.3100 |
| 1 | Daily SMA50 | 17.0995 |
| 2 | Daily SMA100 | 17.1902 |
| 3 | Daily SMA200 | 17.8489 |
The previous day high was 17.7387 while the previous day low was 17.5392. The daily 38.2% Fib levels comes at 17.6155, expected to provide resistance. Similarly, the daily 61.8% fib level is at 17.6625, expected to provide resistance.
Note the levels of interest below:
- Pivot support is noted at 17.4745, 17.4071, 17.275
- Pivot resistance is noted at 17.674, 17.8061, 17.8735
| Levels | Levels.1 |
|---|---|
| Previous Daily High | 17.7387 |
| Previous Daily Low | 17.5392 |
| Previous Weekly High | 17.2506 |
| Previous Weekly Low | 16.9982 |
| Previous Monthly High | 17.4274 |
| Previous Monthly Low | 16.6945 |
| Daily Fibonacci 38.2% | 17.6155 |
| Daily Fibonacci 61.8% | 17.6625 |
| Daily Pivot Point S1 | 17.4745 |
| Daily Pivot Point S2 | 17.4071 |
| Daily Pivot Point S3 | 17.2750 |
| Daily Pivot Point R1 | 17.6740 |
| Daily Pivot Point R2 | 17.8061 |
| Daily Pivot Point R3 | 17.8735 |
[/s2If]
Download Nehcap EAWe have two EAs that are operational on our LIVE accounts.
- EA-FIX: Check out the details here. Download EA-FIX . EA-FIX is a non-grid HFT scalper.
- EA-GROWTH: High quality low dd EA using trend grids. Download EA_GROWTHJoin Our Telegram Group
")


