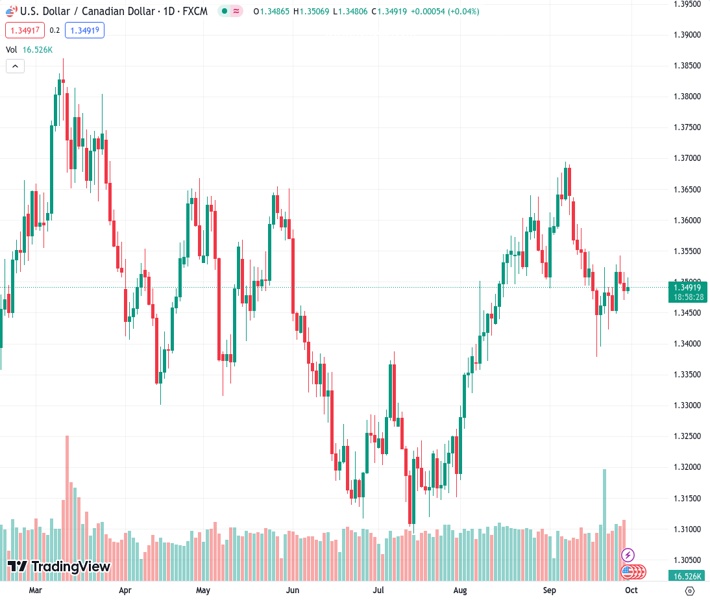
The US dollar to Canadian dollar exchange rate, trading at 1.34923, experiences a recovery on Friday and ends a two-day period of losses.
…
This is a premium post.
[s2If !current_user_can(access_s2member_level4)]Please register for FREE REGISTER to read full post below containing analysis. In case of any error or you think you are not able to read the full post below, please email us at support#nehcap.com [lwa][/s2If] [s2If current_user_can(access_s2member_level1)]
- USD/CAD regains some positive traction on Friday and snaps a two-day losing streak.
The pair currently trades last at 1.34923.
The previous day high was 1.3516 while the previous day low was 1.347. The daily 38.2% Fib levels comes at 1.3488, expected to provide support. Similarly, the daily 61.8% fib level is at 1.3499, expected to provide resistance.
The USD/CAD pair attracts fresh buying during the Asian session on Friday and for now, seems to have snapped a two-day losing streak. Spot prices struggle to capitalize on the move beyond the 1.3500 psychological mark, though remain well within the striking distance of over a one-week high touched on Wednesday
Crude Oil prices languish below a one-year peak set the previous day, which, in turn, is seen undermining the commodity-linked Loonie and acting as a tailwind for the USD/CAD pair. Expectations of supply increases by Russia and Saudi Arabia, to a larger extent, outweigh the optimistic view over a pickup in demand from China during its Golden Week holiday. This prompts traders to lighten their bullish bets around the black liquid, especially after this week’s nearly 8% rally from the vicinity of mid-$88.00s.
Apart from this, the underlying strong bullish tone surrounding the US Dollar (USD) offers additional support to the USD/CAD pair. As investors look past Thursday’s rather unimpressive US macro data, growing acceptance that the Federal Reserve (Fed) helps limit the USD corrective decline from its highest level since November 2022 touched on Thursday. In fact, the US central bank warned last week that sticky inflation in the US was likely to attract at least one more rate hike by the end of this year.
Hence, the market focus will remain glued to the release of the US Core PCE Price Index – the Fed’s preferred inflation gauge – later during the early North American session. The data will play a key role in influencing market expectations about the next policy move by the Fed, which, in turn, will drive the USD demand and provide a fresh impetus to the USD/CAD pair. Traders on Friday will further take cues from the monthly Canadian GDP and Oil price dynamics to grab short-term opportunities.
In the meantime, th prospects for further policy tightening by the Fed remains supportive of elevated US Treasury bond yields, which should continue to act as a tailwind for the buck and the USD/CAD pair. Nevertheless, spot prices seem poised to register modest weekly gains for the first time in the previous three.
Technical Levels: Supports and Resistances
USDCAD currently trading at 1.3498 at the time of writing. Pair opened at 1.3487 and is trading with a change of 0.08 % .
| Overview | Overview.1 | |
|---|---|---|
| 0 | Today last price | 1.3498 |
| 1 | Today Daily Change | 0.0011 |
| 2 | Today Daily Change % | 0.0800 |
| 3 | Today daily open | 1.3487 |
The pair is trading below its 20 Daily moving average @ 1.3541, above its 50 Daily moving average @ 1.3466 , above its 100 Daily moving average @ 1.3403 and above its 200 Daily moving average @ 1.3459
| Trends | Trends.1 | |
|---|---|---|
| 0 | Daily SMA20 | 1.3541 |
| 1 | Daily SMA50 | 1.3466 |
| 2 | Daily SMA100 | 1.3403 |
| 3 | Daily SMA200 | 1.3459 |
The previous day high was 1.3516 while the previous day low was 1.347. The daily 38.2% Fib levels comes at 1.3488, expected to provide support. Similarly, the daily 61.8% fib level is at 1.3499, expected to provide resistance.
Note the levels of interest below:
- Pivot support is noted at 1.3466, 1.3445, 1.342
- Pivot resistance is noted at 1.3512, 1.3537, 1.3558
| Levels | Levels.1 |
|---|---|
| Previous Daily High | 1.3516 |
| Previous Daily Low | 1.3470 |
| Previous Weekly High | 1.3528 |
| Previous Weekly Low | 1.3379 |
| Previous Monthly High | 1.3640 |
| Previous Monthly Low | 1.3184 |
| Daily Fibonacci 38.2% | 1.3488 |
| Daily Fibonacci 61.8% | 1.3499 |
| Daily Pivot Point S1 | 1.3466 |
| Daily Pivot Point S2 | 1.3445 |
| Daily Pivot Point S3 | 1.3420 |
| Daily Pivot Point R1 | 1.3512 |
| Daily Pivot Point R2 | 1.3537 |
| Daily Pivot Point R3 | 1.3558 |
[/s2If]
Download Nehcap EAWe have two EAs that are operational on our LIVE accounts.
- EA-FIX: Check out the details here. Download EA-FIX . EA-FIX is a non-grid HFT scalper.
- EA-GROWTH: High quality low dd EA using trend grids. Download EA_GROWTHJoin Our Telegram Group
")


