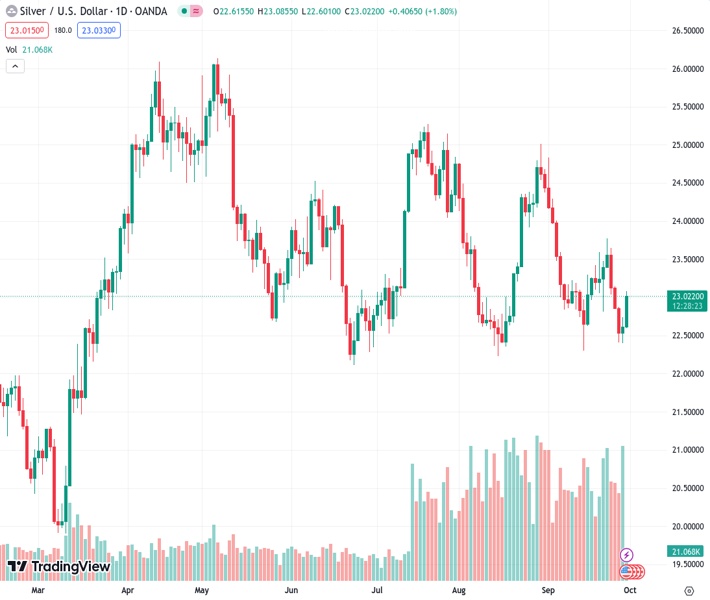
The price of silver, represented by #XAGUSD, shows significant upward momentum on Friday, bouncing back even more strongly from a low point reached two weeks ago.
…
This is a premium post.
[s2If !current_user_can(access_s2member_level4)]Please register for FREE REGISTER to read full post below containing analysis. In case of any error or you think you are not able to read the full post below, please email us at support#nehcap.com [lwa][/s2If] [s2If current_user_can(access_s2member_level1)]
- Silver gains strong positive traction on Friday and recovers further from a two-week low.
The pair currently trades last at 23.028.
The previous day high was 22.74 while the previous day low was 22.4. The daily 38.2% Fib levels comes at 22.61, expected to provide support. Similarly, the daily 61.8% fib level is at 22.53, expected to provide support.
Silver builds on the previous day’s bounce from a support marked by an ascending trend line extending from the June swing low, around the $22.40-$22.35 area, or a two-week low, and scales higher for the second successive day on Friday. The strong intraday move up lifts the white metal to a four-day high during the early European session, albeit stalls near the $23.05-$23.10 confluence hurdle.
Technical indicators on the daily chart, meanwhile, are yet to confirm a near-term positive outlook. Moreover, the Relative Strength Index (RSI) on the daily chart is already flashing overbought conditions and capping the XAG/USD. This makes it prudent to wait for a sustained strength beyond the aforementioned barrier, comprising the 200-hour Simple Moving Average (SMA) and the 50% Fibonacci retracement level of the downfall witnessed over the past week or so, before placing fresh bullish bets.
The XAG/USD might then aim to surpass the $23.20-$23.25 resistance and challenge the very important 200-day SMA, around the $23.45 region. This is followed by last week’s swing high, around the $23.75 area, above which the momentum could get extended towards the $24.00 round figure en route to the $24.30-$24.35 hurdle. Some follow-through buying should pave the way for a further appreciating move and allow bulls to reclaim the $25.00 psychological mark.
On the flip side, any meaningful corrective slide might now find decent support near the $22.70 area or the 23.6% Fibo. level, below which the XAG/USD could slide to the aforementioned trend-line support, around the $22.40-$22.35 region. A convincing break below the latter will be seen as a fresh trigger for bearish traders and make Silver vulnerable to weaken further below the $22.00 mark. The downward trajectory could get extended towards the $21.25 intermediate support before the white metal eventually drops to the $21.00 level.
Technical Levels: Supports and Resistances
XAGUSD currently trading at 23.01 at the time of writing. Pair opened at 22.62 and is trading with a change of 1.72 % .
| Overview | Overview.1 | |
|---|---|---|
| 0 | Today last price | 23.01 |
| 1 | Today Daily Change | 0.39 |
| 2 | Today Daily Change % | 1.72 |
| 3 | Today daily open | 22.62 |
The pair remains strongly bearish on the daily time frame. It trades below the 20 SMA @ 23.17, 50 SMA 23.49, 100 SMA @ 23.53 and 200 SMA @ 23.46.
| Trends | Trends.1 | |
|---|---|---|
| 0 | Daily SMA20 | 23.17 |
| 1 | Daily SMA50 | 23.49 |
| 2 | Daily SMA100 | 23.53 |
| 3 | Daily SMA200 | 23.46 |
The previous day high was 22.74 while the previous day low was 22.4. The daily 38.2% Fib levels comes at 22.61, expected to provide support. Similarly, the daily 61.8% fib level is at 22.53, expected to provide support.
Note the levels of interest below:
- Pivot support is noted at 22.43, 22.25, 22.1
- Pivot resistance is noted at 22.77, 22.92, 23.11
| Levels | Levels.1 |
|---|---|
| Previous Daily High | 22.74 |
| Previous Daily Low | 22.40 |
| Previous Weekly High | 23.78 |
| Previous Weekly Low | 22.81 |
| Previous Monthly High | 25.02 |
| Previous Monthly Low | 22.23 |
| Daily Fibonacci 38.2% | 22.61 |
| Daily Fibonacci 61.8% | 22.53 |
| Daily Pivot Point S1 | 22.43 |
| Daily Pivot Point S2 | 22.25 |
| Daily Pivot Point S3 | 22.10 |
| Daily Pivot Point R1 | 22.77 |
| Daily Pivot Point R2 | 22.92 |
| Daily Pivot Point R3 | 23.11 |
[/s2If]
Download Nehcap EAWe have two EAs that are operational on our LIVE accounts.
- EA-FIX: Check out the details here. Download EA-FIX . EA-FIX is a non-grid HFT scalper.
- EA-GROWTH: High quality low dd EA using trend grids. Download EA_GROWTHJoin Our Telegram Group
")


