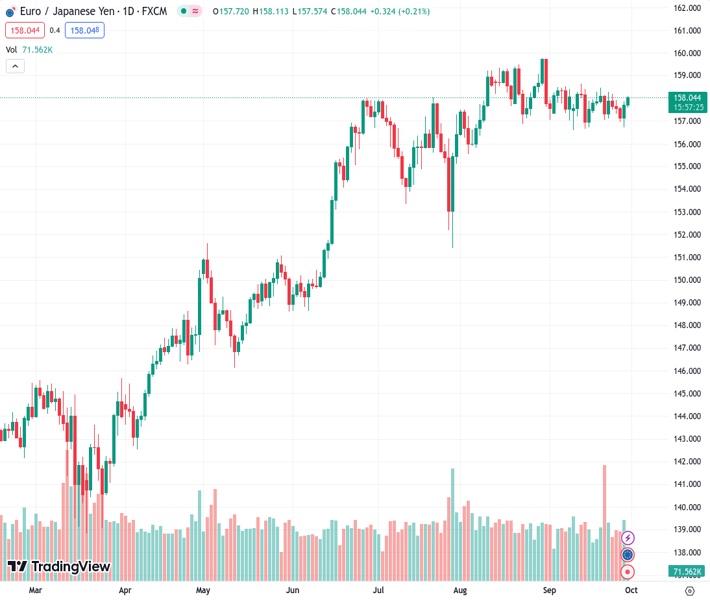
The EURJPY pair remains close to 158.00, while the Relative Strength Index (RSI) shows a bullish trend and is positioned above the 50 level.
…
This is a premium post.
[s2If !current_user_can(access_s2member_level4)]Please register for FREE REGISTER to read full post below containing analysis. In case of any error or you think you are not able to read the full post below, please email us at support#nehcap.com [lwa][/s2If] [s2If current_user_can(access_s2member_level1)]
- EUR/JPY hovers around 158.00; Relative Strength Index (RSI) stands in bullish territory above 50.
The pair currently trades last at 158.028.
The previous day high was 157.87 while the previous day low was 156.71. The daily 38.2% Fib levels comes at 157.43, expected to provide support. Similarly, the daily 61.8% fib level is at 157.15, expected to provide support.
The EUR/JPY cross holds positive ground near 158.00 during the Asian session on Friday. Market players await the German Retail Sales data for fresh impetus. The annual figure for August is expected to drop 0.7% from the previous reading of a 2.2% fall. The report could trigger the volatility in the cross.
From a technical perspective, EUR/JPY holds above the 50- and 100-hour Exponential Moving Averages (EMAs) on the one-hour chart. It’s worth noting that the 50-hour EMA is on the verge of crossing above the 100-hour EMA. If a decisive crossover occurs on the one-hour chart, it would validate a Bull Cross, highlighting the path of least resistance for EUR/JPY is to the upside.
The immediate resistance level for the cross is located near the upper boundary of the Bollinger Band at 158.15. A break above the latter will see the next barrier at 158.45 (a high of September 20). Further north, the additional upside filter is seen around a high of September 13 at 158.65, followed by a Year-To-Date (YTD) high of 159.76.
On the flip side, the convergence of the 50-hour EMA and 100-hour EMA at 157.50 will be the key support level for EUR/JPY. The next contention level will emerge at 157.20, representing the lower limit of the Bollinger Band. Any follow-through selling below the latter will see a drop to 156.95 (a low of September 27), and finally at 156.70 (a low of September 28).
Meanwhile, the Relative Strength Index (RSI) stands in bullish territory above 50, supporting the buyers for now.
Technical Levels: Supports and Resistances
EURJPY currently trading at 158.03 at the time of writing. Pair opened at 157.77 and is trading with a change of 0.16 % .
| Overview | Overview.1 | |
|---|---|---|
| 0 | Today last price | 158.03 |
| 1 | Today Daily Change | 0.26 |
| 2 | Today Daily Change % | 0.16 |
| 3 | Today daily open | 157.77 |
The pair remains strongly bullish on the daily timeframe. It trades above its 20 SMA @ 157.81, 50 SMA 157.63, 100 SMA @ 155.31 and 200 SMA @ 149.39.
| Trends | Trends.1 | |
|---|---|---|
| 0 | Daily SMA20 | 157.81 |
| 1 | Daily SMA50 | 157.63 |
| 2 | Daily SMA100 | 155.31 |
| 3 | Daily SMA200 | 149.39 |
The previous day high was 157.87 while the previous day low was 156.71. The daily 38.2% Fib levels comes at 157.43, expected to provide support. Similarly, the daily 61.8% fib level is at 157.15, expected to provide support.
Note the levels of interest below:
- Pivot support is noted at 157.03, 156.29, 155.87
- Pivot resistance is noted at 158.19, 158.61, 159.35
| Levels | Levels.1 |
|---|---|
| Previous Daily High | 157.87 |
| Previous Daily Low | 156.71 |
| Previous Weekly High | 158.45 |
| Previous Weekly Low | 157.04 |
| Previous Monthly High | 159.76 |
| Previous Monthly Low | 155.53 |
| Daily Fibonacci 38.2% | 157.43 |
| Daily Fibonacci 61.8% | 157.15 |
| Daily Pivot Point S1 | 157.03 |
| Daily Pivot Point S2 | 156.29 |
| Daily Pivot Point S3 | 155.87 |
| Daily Pivot Point R1 | 158.19 |
| Daily Pivot Point R2 | 158.61 |
| Daily Pivot Point R3 | 159.35 |
[/s2If]
Download Nehcap EAWe have two EAs that are operational on our LIVE accounts.
- EA-FIX: Check out the details here. Download EA-FIX . EA-FIX is a non-grid HFT scalper.
- EA-GROWTH: High quality low dd EA using trend grids. Download EA_GROWTHJoin Our Telegram Group
")


