The AUDUSD is experiencing some selling pressure around the 0.6500 level, but there is still a preference for more gains in the future.
…
This is a premium post.
[s2If !current_user_can(access_s2member_level4)]Please register for FREE REGISTER to read full post below containing analysis. In case of any error or you think you are not able to read the full post below, please email us at support#nehcap.com [lwa][/s2If] [s2If current_user_can(access_s2member_level1)]
- AUD/USD finds nominal selling pressure near 0.6500 while more upside remains favored.
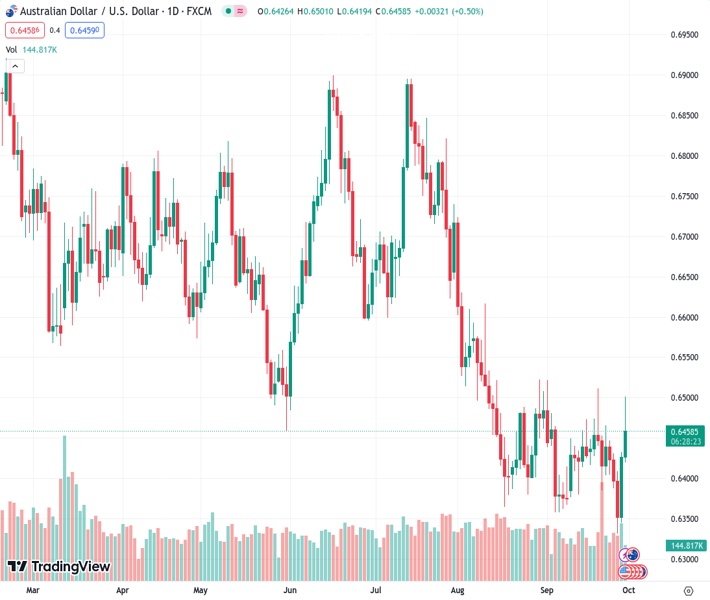
The pair currently trades last at 0.64563.
The previous day high was 0.6432 while the previous day low was 0.6345. The daily 38.2% Fib levels comes at 0.6399, expected to provide support. Similarly, the daily 61.8% fib level is at 0.6378, expected to provide support.
The AUD/USD pair rallied to near the psychological resistance of 0.6500 but struggled to extend further as the US Dollar Index (DXY) discovered buying interest after correcting to near 105.66.
The S&P500 opens on a bullish note as the market mood turns cheerful. The appeal for the risk-sensitive assets improved as investors started digesting fears of a global slowdown due to higher interest rates by central bankers. The 10-year US Treasury yields dropped sharply to 4.51% after soft United States core Personal Consumption Expenditure (PCE) price index data for August.
Monthly core PCE expanded at a nominal pace of 0.1% in August against expectations and the former release of 0.2%. The annualized PCE has softened to 3.9% as expected from the former release of 4.3%. This may buy some more time for the Federal Reserve (Fed) to assess the impact of the interest rate hikes till made.
Going forward, investors will focus on the US Manufacturing PMI report for September to be released by the Institute of Supply Management (ISM) agency. As per the expectations, the Manufacturing PMI is expected to contract consecutively for the 11th month. A figure below the 50.0 threshold is considered as contraction in economic activities. The economic data is seen improving to 47.8 vs. 47.6 reading from August.
On the Australian Dollar front, investors await the interest rate decision by the Reserve Bank of Australia (RBA), which will be announced on Tuesday. The RBA is expected to keep interest rates unchanged at 4.10% but economists see the interest rate peak at 4.35% by the year-end, according to a Reuters poll.
Technical Levels: Supports and Resistances
AUDUSD currently trading at 0.6464 at the time of writing. Pair opened at 0.6427 and is trading with a change of 0.58 % .
| Overview | Overview.1 | |
|---|---|---|
| 0 | Today last price | 0.6464 |
| 1 | Today Daily Change | 0.0037 |
| 2 | Today Daily Change % | 0.5800 |
| 3 | Today daily open | 0.6427 |
The pair is trading above its 20 Daily moving average @ 0.6419, below its 50 Daily moving average @ 0.6492 , below its 100 Daily moving average @ 0.6591 and below its 200 Daily moving average @ 0.6691
| Trends | Trends.1 | |
|---|---|---|
| 0 | Daily SMA20 | 0.6419 |
| 1 | Daily SMA50 | 0.6492 |
| 2 | Daily SMA100 | 0.6591 |
| 3 | Daily SMA200 | 0.6691 |
The previous day high was 0.6432 while the previous day low was 0.6345. The daily 38.2% Fib levels comes at 0.6399, expected to provide support. Similarly, the daily 61.8% fib level is at 0.6378, expected to provide support.
Note the levels of interest below:
- Pivot support is noted at 0.637, 0.6314, 0.6283
- Pivot resistance is noted at 0.6458, 0.6489, 0.6546
| Levels | Levels.1 |
|---|---|
| Previous Daily High | 0.6432 |
| Previous Daily Low | 0.6345 |
| Previous Weekly High | 0.6511 |
| Previous Weekly Low | 0.6385 |
| Previous Monthly High | 0.6724 |
| Previous Monthly Low | 0.6364 |
| Daily Fibonacci 38.2% | 0.6399 |
| Daily Fibonacci 61.8% | 0.6378 |
| Daily Pivot Point S1 | 0.6370 |
| Daily Pivot Point S2 | 0.6314 |
| Daily Pivot Point S3 | 0.6283 |
| Daily Pivot Point R1 | 0.6458 |
| Daily Pivot Point R2 | 0.6489 |
| Daily Pivot Point R3 | 0.6546 |
[/s2If]
Download Nehcap EAWe have two EAs that are operational on our LIVE accounts.
- EA-FIX: Check out the details here. Download EA-FIX . EA-FIX is a non-grid HFT scalper.
- EA-GROWTH: High quality low dd EA using trend grids. Download EA_GROWTHJoin Our Telegram Group
")


