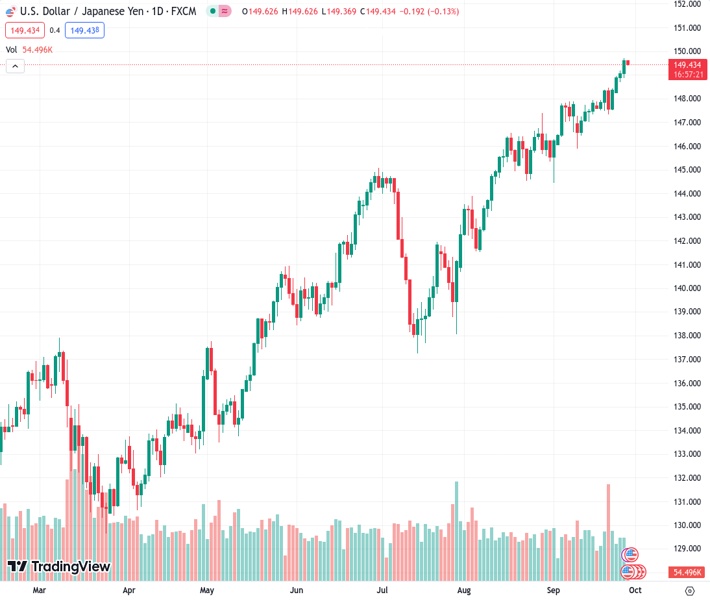
USDJPY at 149.423 is edging back slightly, but still maintaining a positive direction and staying below the 149.50 mark.
…
This is a premium post.
[s2If !current_user_can(access_s2member_level4)]Please register for FREE REGISTER to read full post below containing analysis. In case of any error or you think you are not able to read the full post below, please email us at support#nehcap.com [lwa][/s2If] [s2If current_user_can(access_s2member_level1)]
- USD/JPY retreats with a positive bias, holding grounds below 149.50.
The pair currently trades last at 149.423.
The previous day high was 149.71 while the previous day low was 148.86. The daily 38.2% Fib levels comes at 149.39, expected to provide support. Similarly, the daily 61.8% fib level is at 149.19, expected to provide support.
USD/JPY retreats with a positive bias from the highs since November, trading lower around 149.40 during the Asian session on Thursday. The pair is under pressure due to market caution about the US Federal Reserve’s (Fed) interest rate trajectory, coupled with higher US Treasury yields and economic data.
However, Japanese Finance Minister Shunichi Suzuki reaffirmed on Thursday that he is open to taking any necessary measures to address excessive foreign exchange (FX) market volatility. Suzuki also emphasizes that currencies move in a stable manner. The policymaker is closely watching FX moves with a sense of urgency, although declined to comment on any plans for a rate check.
The current upward momentum in USD/JPY appears to have a potential bullish bias, given that the 14-day Relative Strength Index (RSI) remains above the 50 level. However, there is a psychological resistance level at 150.00 that may pose a challenge for further gains.
If there’s a strong breakthrough above the level, it could serve as an encouragement for USD/JPY bulls to explore higher levels, potentially targeting the area around the October high at 151.94.
On the flip side, the USD/JPY pair may encounter significant support levels in its price movement. The first notable support level could be around the 14-day Exponential Moving Average (EMA) at 148.27. Below that, there is the psychological support level at 148.00, which often holds significance in market dynamics.
If the pair breaks below the latter, it may then navigate towards the region around the psychological support level at 147.00, followed by the 23.6% Fibonacci retracement at 146.76.
The Moving Average Convergence Divergence (MACD) indicator is providing a bullish signal for the USD/JPY pair. The MACD line is positioned above both the centerline and the signal line. This configuration suggests that there is potentially strong momentum in the USD/JPY’s price movement, indicating a prevailing bullish sentiment in the market.
Technical Levels: Supports and Resistances
USDJPY currently trading at 149.42 at the time of writing. Pair opened at 149.64 and is trading with a change of -0.15 % .
| Overview | Overview.1 | |
|---|---|---|
| 0 | Today last price | 149.42 |
| 1 | Today Daily Change | -0.22 |
| 2 | Today Daily Change % | -0.15 |
| 3 | Today daily open | 149.64 |
The pair remains strongly bullish on the daily timeframe. It trades above its 20 SMA @ 147.63, 50 SMA 145.34, 100 SMA @ 142.87 and 200 SMA @ 137.87.
| Trends | Trends.1 | |
|---|---|---|
| 0 | Daily SMA20 | 147.63 |
| 1 | Daily SMA50 | 145.34 |
| 2 | Daily SMA100 | 142.87 |
| 3 | Daily SMA200 | 137.87 |
The previous day high was 149.71 while the previous day low was 148.86. The daily 38.2% Fib levels comes at 149.39, expected to provide support. Similarly, the daily 61.8% fib level is at 149.19, expected to provide support.
Note the levels of interest below:
- Pivot support is noted at 149.1, 148.56, 148.25
- Pivot resistance is noted at 149.95, 150.25, 150.79
| Levels | Levels.1 |
|---|---|
| Previous Daily High | 149.71 |
| Previous Daily Low | 148.86 |
| Previous Weekly High | 148.46 |
| Previous Weekly Low | 147.32 |
| Previous Monthly High | 147.38 |
| Previous Monthly Low | 141.51 |
| Daily Fibonacci 38.2% | 149.39 |
| Daily Fibonacci 61.8% | 149.19 |
| Daily Pivot Point S1 | 149.10 |
| Daily Pivot Point S2 | 148.56 |
| Daily Pivot Point S3 | 148.25 |
| Daily Pivot Point R1 | 149.95 |
| Daily Pivot Point R2 | 150.25 |
| Daily Pivot Point R3 | 150.79 |
[/s2If]
Download Nehcap EAWe have two EAs that are operational on our LIVE accounts.
- EA-FIX: Check out the details here. Download EA-FIX . EA-FIX is a non-grid HFT scalper.
- EA-GROWTH: High quality low dd EA using trend grids. Download EA_GROWTHJoin Our Telegram Group
")


