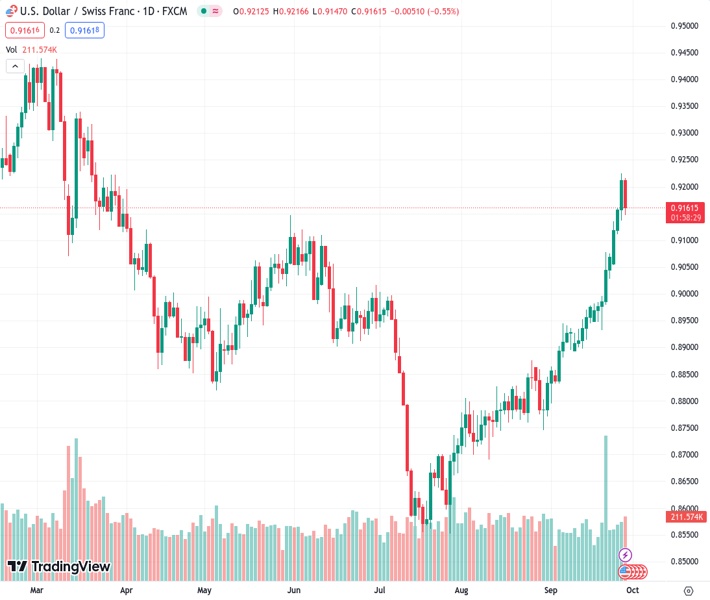
The USDCHF currency pair dropped to approximately 0.9150 from its recent peak of 0.9225.
…
This is a premium post.
[s2If !current_user_can(access_s2member_level4)]Please register for FREE REGISTER to read full post below containing analysis. In case of any error or you think you are not able to read the full post below, please email us at support#nehcap.com [lwa][/s2If] [s2If current_user_can(access_s2member_level1)]
- USD/CHF retreats to around 0.9150 after reaching a new cycle high at 0.9225.
The pair currently trades last at 0.91627.
The previous day high was 0.9225 while the previous day low was 0.9145. The daily 38.2% Fib levels comes at 0.9195, expected to provide resistance. Similarly, the daily 61.8% fib level is at 0.9176, expected to provide resistance.
USD/CHF reverses its direction after rallying for 16 straight days, though the pair loses steam as technical indicators signal the major is overbought. Hence, the USD/CHF is trading at around 0.9150s, down 0.57%.
The uptrend remains intact, as shown by the daily chart, as the USD/CHF reached a new cycle high at 0.9225 and broke above the 200-day moving average (DMA) at 0.9029. However, to resume its uptrend, the major must rally past the former, so buyers can challenge the year-to-date (YTD) highs at 0.9440. A breach of the latter can open the door for parity.
In short, the USD/CHF hourly chart portrays the break of market structure on the downside. After hitting a multi-month high, the major retraced below 0.9200, extending its losses past the 50-hour moving average (HMA) at 0.9182. That exacerbated a fall below the 61.8% Fibonacci retracement, though lately buyers stepped in, and lifted the spot price above 0.9159. If the USD/CHF reclaims 0.9200, a test of September’s high at 0.9225 is on the cards. Otherwise, expect a drop towards 0.9100, followed by the 200-HMA at 0.9071.
Technical Levels: Supports and Resistances
USDCHF currently trading at 0.9158 at the time of writing. Pair opened at 0.9213 and is trading with a change of -0.6 % .
| Overview | Overview.1 | |
|---|---|---|
| 0 | Today last price | 0.9158 |
| 1 | Today Daily Change | -0.0055 |
| 2 | Today Daily Change % | -0.6000 |
| 3 | Today daily open | 0.9213 |
The pair remains strongly bullish on the daily timeframe. It trades above its 20 SMA @ 0.8971, 50 SMA 0.8841, 100 SMA @ 0.8894 and 200 SMA @ 0.9033.
| Trends | Trends.1 | |
|---|---|---|
| 0 | Daily SMA20 | 0.8971 |
| 1 | Daily SMA50 | 0.8841 |
| 2 | Daily SMA100 | 0.8894 |
| 3 | Daily SMA200 | 0.9033 |
The previous day high was 0.9225 while the previous day low was 0.9145. The daily 38.2% Fib levels comes at 0.9195, expected to provide resistance. Similarly, the daily 61.8% fib level is at 0.9176, expected to provide resistance.
Note the levels of interest below:
- Pivot support is noted at 0.9164, 0.9114, 0.9083
- Pivot resistance is noted at 0.9244, 0.9275, 0.9325
| Levels | Levels.1 |
|---|---|
| Previous Daily High | 0.9225 |
| Previous Daily Low | 0.9145 |
| Previous Weekly High | 0.9078 |
| Previous Weekly Low | 0.8932 |
| Previous Monthly High | 0.8876 |
| Previous Monthly Low | 0.8690 |
| Daily Fibonacci 38.2% | 0.9195 |
| Daily Fibonacci 61.8% | 0.9176 |
| Daily Pivot Point S1 | 0.9164 |
| Daily Pivot Point S2 | 0.9114 |
| Daily Pivot Point S3 | 0.9083 |
| Daily Pivot Point R1 | 0.9244 |
| Daily Pivot Point R2 | 0.9275 |
| Daily Pivot Point R3 | 0.9325 |
[/s2If]
Download Nehcap EAWe have two EAs that are operational on our LIVE accounts.
- EA-FIX: Check out the details here. Download EA-FIX . EA-FIX is a non-grid HFT scalper.
- EA-GROWTH: High quality low dd EA using trend grids. Download EA_GROWTHJoin Our Telegram Group
")


