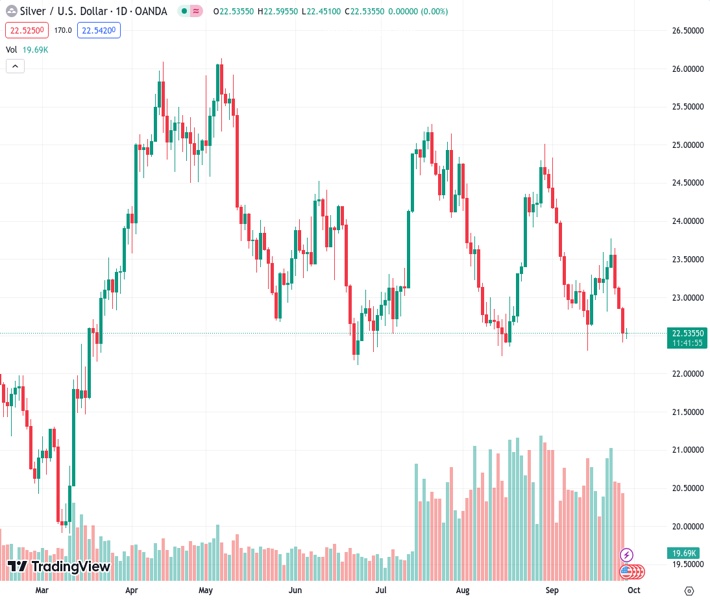
The price of silver, represented by the symbol #XAGUSD, is currently trading at 22.522. It is holding steady within a certain range, slightly above the lowest point it reached in almost two weeks, which occurred on Wednesday.
…
This is a premium post.
[s2If !current_user_can(access_s2member_level4)]Please register for FREE REGISTER to read full post below containing analysis. In case of any error or you think you are not able to read the full post below, please email us at support#nehcap.com [lwa][/s2If] [s2If current_user_can(access_s2member_level1)]
- Silver consolidates in a range just above a nearly two-week low touched on Wednesday.
The pair currently trades last at 22.522.
The previous day high was 22.88 while the previous day low was 22.41. The daily 38.2% Fib levels comes at 22.59, expected to provide resistance. Similarly, the daily 61.8% fib level is at 22.7, expected to provide resistance.
Silver struggles to gain any meaningful traction on Thursday and oscillates in a narrow band, around mid-$22.00s through the first half of the European session. The white metal remains well within the striking distance of a nearly two-week low, around the $22.40 region touched on Wednesday, which is closely followed by an ascending trend line support extending from the June monthly low.
The latter is currently pegged around the $22.35 area, which if broken will be seen as a fresh trigger for bearish traders and set the stage for an extension of the recent downfall witnessed over the past week or so. Given that oscillators on the daily chart are holding deep in the negative territory and are still far from being in the oversold zone, the XAG/USD might then slide to test the next relevant support near the $22.00 round-figure mark. Some follow-through selling could accelerate the downward trajectory further towards the $21.25 intermediate support en route to the $21.00 level.
On the flip side, the $22.75-$22.80 region is likely to act as an immediate hurdle ahead of the $23.00 mark and the $23.20-$23.25 zone. This is closely followed by the very important 200-day Simple Moving Average (SMA), currently around the $23.45 region and last week’s swing high, around the $23.75 area. A convincing break through the said barrier should lift the XAG/USD to the $24.00 round figure en route to the $24.30-$24.35 barrier. Bulls might eventually aim to reclaim the $25.00 psychological mark.
Technical Levels: Supports and Resistances
XAGUSD currently trading at 22.56 at the time of writing. Pair opened at 22.55 and is trading with a change of 0.04 % .
| Overview | Overview.1 | |
|---|---|---|
| 0 | Today last price | 22.56 |
| 1 | Today Daily Change | 0.01 |
| 2 | Today Daily Change % | 0.04 |
| 3 | Today daily open | 22.55 |
The pair remains strongly bearish on the daily time frame. It trades below the 20 SMA @ 23.25, 50 SMA 23.54, 100 SMA @ 23.55 and 200 SMA @ 23.47.
| Trends | Trends.1 | |
|---|---|---|
| 0 | Daily SMA20 | 23.25 |
| 1 | Daily SMA50 | 23.54 |
| 2 | Daily SMA100 | 23.55 |
| 3 | Daily SMA200 | 23.47 |
The previous day high was 22.88 while the previous day low was 22.41. The daily 38.2% Fib levels comes at 22.59, expected to provide resistance. Similarly, the daily 61.8% fib level is at 22.7, expected to provide resistance.
Note the levels of interest below:
- Pivot support is noted at 22.34, 22.14, 21.87
- Pivot resistance is noted at 22.81, 23.08, 23.29
| Levels | Levels.1 |
|---|---|
| Previous Daily High | 22.88 |
| Previous Daily Low | 22.41 |
| Previous Weekly High | 23.78 |
| Previous Weekly Low | 22.81 |
| Previous Monthly High | 25.02 |
| Previous Monthly Low | 22.23 |
| Daily Fibonacci 38.2% | 22.59 |
| Daily Fibonacci 61.8% | 22.70 |
| Daily Pivot Point S1 | 22.34 |
| Daily Pivot Point S2 | 22.14 |
| Daily Pivot Point S3 | 21.87 |
| Daily Pivot Point R1 | 22.81 |
| Daily Pivot Point R2 | 23.08 |
| Daily Pivot Point R3 | 23.29 |
[/s2If]
Download Nehcap EAWe have two EAs that are operational on our LIVE accounts.
- EA-FIX: Check out the details here. Download EA-FIX . EA-FIX is a non-grid HFT scalper.
- EA-GROWTH: High quality low dd EA using trend grids. Download EA_GROWTHJoin Our Telegram Group
")


