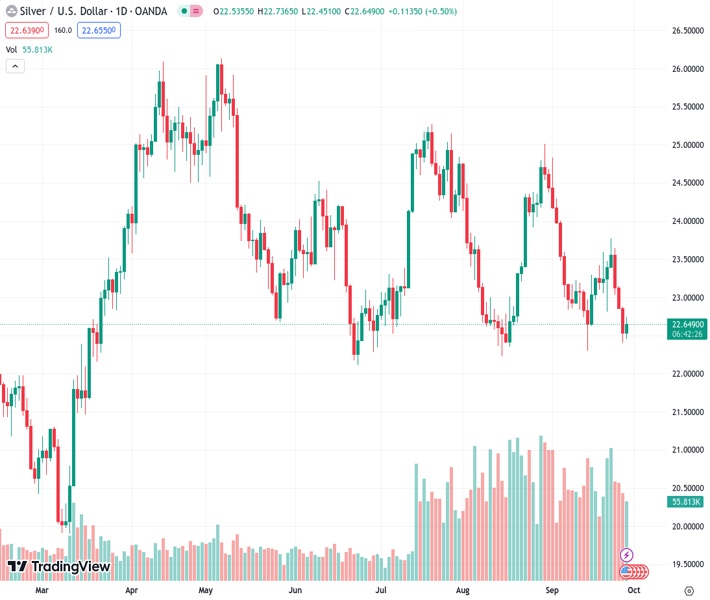
The price of silver is experiencing turbulent fluctuations around the $22.50 mark as the US Dollar tries to regain strength.
…
This is a premium post.
[s2If !current_user_can(access_s2member_level4)]Please register for FREE REGISTER to read full post below containing analysis. In case of any error or you think you are not able to read the full post below, please email us at support#nehcap.com [lwa][/s2If] [s2If current_user_can(access_s2member_level1)]
- Silver price delivers volatile moves near $22.50 as US Dollar attempts recovery.
The pair currently trades last at 22.710.
The previous day high was 22.88 while the previous day low was 22.41. The daily 38.2% Fib levels comes at 22.59, expected to provide support. Similarly, the daily 61.8% fib level is at 22.7, expected to provide support.
Silver price (XAG/USD) demonstrates a volatile action near $22.50 after the release of lower-than-anticipated weekly Jobless Claims data for the week ending September 22. The US Department of Labor reported that individuals claiming jobless claims for the first time increased by 2K to 204K from the previous week’s release but remained lower than expectations of 215K.
Meanwhile, the final reading of real Gross Domestic Product (GDP) for the April-June quarter remained in line with the previous estimate and the market expectation of 2.1% on an annualized basis.
The US Dollar Index (DXY) corrects to 106.20 after refreshing a six-month high near 106.80 as profit-booking kicks in. The broader bias for the US Dollar is still bullish as the US economy is resilient due to falling inflation, an upbeat labor market, and robust consumer spending. The 10-year US Treasury yields jump to near 4.65%, showing strength in expectations of one more interest rate hike from the Federal Reserve (Fed).
Minneapolis Federal Reserve Bank President Neel Kashkari said on Wednesday that he is unsure whether the central bank has hiked enough to bring down core inflation to 2%.
For further guidance, investors will focus on the US core Personal Consumption Expenditure (PCE) price Index data for August, which will be published on Friday at 12:30 GMT.
Silver price forms a Head and Shoulder chart pattern on a daily scale, which indicates a prolonged consolidation whose breakdown triggers a bearish reversal. The neckline of the aforementioned chart pattern is plotted from June 23 low at $22.11. The white metal trades below the 20-day Exponential Moving Average (EMA) at $23.15, which indicates that the short-term trend is bearish.
The Relative Strength Index (RSI) (14) slips below 40.00, indicating no signs of divergence and oversold, warranting more downside.
Technical Levels: Supports and Resistances
XAGUSD currently trading at 22.48 at the time of writing. Pair opened at 22.55 and is trading with a change of -0.31 % .
| Overview | Overview.1 | |
|---|---|---|
| 0 | Today last price | 22.48 |
| 1 | Today Daily Change | -0.07 |
| 2 | Today Daily Change % | -0.31 |
| 3 | Today daily open | 22.55 |
The pair remains strongly bearish on the daily time frame. It trades below the 20 SMA @ 23.25, 50 SMA 23.54, 100 SMA @ 23.55 and 200 SMA @ 23.47.
| Trends | Trends.1 | |
|---|---|---|
| 0 | Daily SMA20 | 23.25 |
| 1 | Daily SMA50 | 23.54 |
| 2 | Daily SMA100 | 23.55 |
| 3 | Daily SMA200 | 23.47 |
The previous day high was 22.88 while the previous day low was 22.41. The daily 38.2% Fib levels comes at 22.59, expected to provide support. Similarly, the daily 61.8% fib level is at 22.7, expected to provide support.
Note the levels of interest below:
- Pivot support is noted at 22.34, 22.14, 21.87
- Pivot resistance is noted at 22.81, 23.08, 23.29
| Levels | Levels.1 |
|---|---|
| Previous Daily High | 22.88 |
| Previous Daily Low | 22.41 |
| Previous Weekly High | 23.78 |
| Previous Weekly Low | 22.81 |
| Previous Monthly High | 25.02 |
| Previous Monthly Low | 22.23 |
| Daily Fibonacci 38.2% | 22.59 |
| Daily Fibonacci 61.8% | 22.70 |
| Daily Pivot Point S1 | 22.34 |
| Daily Pivot Point S2 | 22.14 |
| Daily Pivot Point S3 | 21.87 |
| Daily Pivot Point R1 | 22.81 |
| Daily Pivot Point R2 | 23.08 |
| Daily Pivot Point R3 | 23.29 |
[/s2If]
Download Nehcap EAWe have two EAs that are operational on our LIVE accounts.
- EA-FIX: Check out the details here. Download EA-FIX . EA-FIX is a non-grid HFT scalper.
- EA-GROWTH: High quality low dd EA using trend grids. Download EA_GROWTHJoin Our Telegram Group
")


