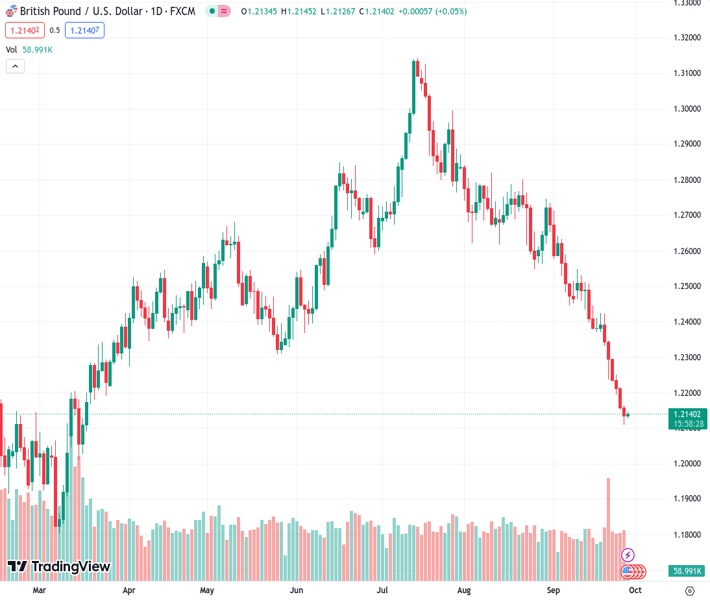
The GBPUSD pair, currently at 1.21394, continues to face downward pressure near 1.2133 after rebounding from its lowest point since March 17, which was at 1.2110.
…
This is a premium post.
[s2If !current_user_can(access_s2member_level4)]Please register for FREE REGISTER to read full post below containing analysis. In case of any error or you think you are not able to read the full post below, please email us at support#nehcap.com [lwa][/s2If] [s2If current_user_can(access_s2member_level1)]
- GBP/USD remains under selling pressure around 1.2133, bouncing off the lowest since March 17 of 1.2110.
The pair currently trades last at 1.21394.
The previous day high was 1.2166 while the previous day low was 1.2111. The daily 38.2% Fib levels comes at 1.2132, expected to provide support. Similarly, the daily 61.8% fib level is at 1.2145, expected to provide resistance.
The GBP/USD pair extends its downside for the seventh consecutive day during the Asian session on Thursday. The downtick of the pair is supported by the firmer US Dollar (USD), higher Treasury Yield and upbeat US economic data. The pair currently trades near 1.2133, losing 0.02% on the day.
The Bank of England (BoE) unexpectedly paused its rate hike cycle while the Federal Reserve (Fed) offered hawkish remarks and signaled that rate additional rate hike is possible. The divergence of monetary policy between the BoE and Fed exerts pressure on the British Pound (GBP) and acts as a headwind for the GBP/USD pair.
According to the four-hour chart, GBP/USD holds below the 50- and 100-hour Exponential Moving Averages (EMAs) with a downward slope, which means further downside looks favorable. The Relative Strength Index (RSI) holds in bearish territory below 50. However, the oversold RSI condition indicates that further consolidation cannot be ruled out before positioning for any near-term GBP/USD depreciation.
The key resistance level for GBP/USD will emerge near the upper boundary of the Bollinger Band and the 50-hour EMA at 1.2250. The additional upside filter is located at 1.2351 (the 100-hour EMA). The next barrier to watch is near a high of September 21 at 1.2421, followed by a psychological round mark at 1.2500.
On the downside, 1.2100 will be the critical support level for the GBP/USD pair. The mentioned level is the confluence of the lower limit of the Bollinger Band, a psychological figure, and a low of March 17. Further south, the next stop is located at 1.2025 (a low of March 16). Any intraday pullback below the latter would expose the next downside stop at 1.2000 (a round mark).
Technical Levels: Supports and Resistances
GBPUSD currently trading at 1.2134 at the time of writing. Pair opened at 1.2135 and is trading with a change of -0.01 % .
| Overview | Overview.1 | |
|---|---|---|
| 0 | Today last price | 1.2134 |
| 1 | Today Daily Change | -0.0001 |
| 2 | Today Daily Change % | -0.0100 |
| 3 | Today daily open | 1.2135 |
The pair remains strongly bearish on the daily time frame. It trades below the 20 SMA @ 1.2417, 50 SMA 1.2615, 100 SMA @ 1.2629 and 200 SMA @ 1.2435.
| Trends | Trends.1 | |
|---|---|---|
| 0 | Daily SMA20 | 1.2417 |
| 1 | Daily SMA50 | 1.2615 |
| 2 | Daily SMA100 | 1.2629 |
| 3 | Daily SMA200 | 1.2435 |
The previous day high was 1.2166 while the previous day low was 1.2111. The daily 38.2% Fib levels comes at 1.2132, expected to provide support. Similarly, the daily 61.8% fib level is at 1.2145, expected to provide resistance.
Note the levels of interest below:
- Pivot support is noted at 1.2108, 1.2082, 1.2053
- Pivot resistance is noted at 1.2164, 1.2193, 1.222
| Levels | Levels.1 |
|---|---|
| Previous Daily High | 1.2166 |
| Previous Daily Low | 1.2111 |
| Previous Weekly High | 1.2425 |
| Previous Weekly Low | 1.2231 |
| Previous Monthly High | 1.2841 |
| Previous Monthly Low | 1.2548 |
| Daily Fibonacci 38.2% | 1.2132 |
| Daily Fibonacci 61.8% | 1.2145 |
| Daily Pivot Point S1 | 1.2108 |
| Daily Pivot Point S2 | 1.2082 |
| Daily Pivot Point S3 | 1.2053 |
| Daily Pivot Point R1 | 1.2164 |
| Daily Pivot Point R2 | 1.2193 |
| Daily Pivot Point R3 | 1.2220 |
[/s2If]
Download Nehcap EAWe have two EAs that are operational on our LIVE accounts.
- EA-FIX: Check out the details here. Download EA-FIX . EA-FIX is a non-grid HFT scalper.
- EA-GROWTH: High quality low dd EA using trend grids. Download EA_GROWTHJoin Our Telegram Group
")


