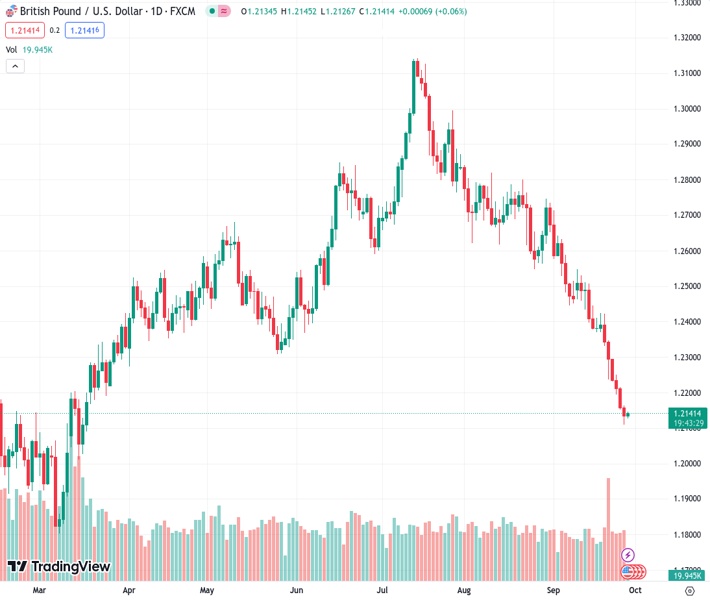
The GBP/USD currency pair, currently trading at 1.21435, continues to recover from a significant decrease over the past few months and shows slight upward movement on Thursday.
…
This is a premium post.
[s2If !current_user_can(access_s2member_level4)]Please register for FREE REGISTER to read full post below containing analysis. In case of any error or you think you are not able to read the full post below, please email us at support#nehcap.com [lwa][/s2If] [s2If current_user_can(access_s2member_level1)]
- GBP/USD builds on the overnight bounce from a multi-month low and edges higher on Thursday.
The pair currently trades last at 1.21435.
The previous day high was 1.2166 while the previous day low was 1.2111. The daily 38.2% Fib levels comes at 1.2132, expected to provide support. Similarly, the daily 61.8% fib level is at 1.2145, expected to provide resistance.
The GBP/USD pair ticks higher during the Asian session on Thursday and moves away from its lowest level since March 17, around the 1.2110 region touched the previous day. Spot prices, however, remain below mid-1.2100s and seem vulnerable to prolonging the well-established downtrend witnessed over the past two months or so.
The US Dollar (USD) pauses following the recent strong runup to a 10-month high and turns out to be a key factor lending some support to the GBP/USD pair. The near-term bias, meanwhile, seems tilted firmly in favour of the USD bulls in the wake of growing acceptance that the Federal Reserve (Fed) will continue to tighten its monetary policy further and keep interest rates higher for longer. The bets were reaffirmed by the overnight hawkish comments by Minneapolis Fed President Neel Kashkari, saying that it is not clear yet whether the central bank is finished raising rates amid ample evidence of ongoing economic strength.
Adding to this, the better-than-expected release of the US Durable Goods Orders prompted some economists to raise the third-quarter GDP growth estimates and lifted bets for at least one more Fed rate hike move by the end of this year. This led to an extended selloff in the US fixed-income market, pushing the yield on the benchmark 10-year US government bond to a fresh 16-year peak, further beyond the 4.50% threshold, which continues to underpin the Greenback. That said, extremely overbought conditions hold back the USD bulls from placing fresh bets and act as a tailwind for the GBP/USD pair, though any meaningful recovery seems elusive.
The Bank of England (BoE) surprisingly paused its interest rate hiking cycle and also provided little evidence of it intends to raise rates any further. This marks a divergence in comparison to the Fd’s hawkish outlook, which, in turn, suggests that the path of least resistance for the GBP/USD pair is to the upside. Hence, any subsequent move up might be seen as a selling opportunity and runs the risk of fizzling out rather quickly. Traders now look to the release of the final US Q2 GDP print, due later during the early North American session. This, along with the US bond yields, will influence the USD and provide some impetus to the GBP/USD pair.
Technical Levels: Supports and Resistances
GBPUSD currently trading at 1.2144 at the time of writing. Pair opened at 1.2135 and is trading with a change of 0.07 % .
| Overview | Overview.1 | |
|---|---|---|
| 0 | Today last price | 1.2144 |
| 1 | Today Daily Change | 0.0009 |
| 2 | Today Daily Change % | 0.0700 |
| 3 | Today daily open | 1.2135 |
The pair remains strongly bearish on the daily time frame. It trades below the 20 SMA @ 1.2417, 50 SMA 1.2615, 100 SMA @ 1.2629 and 200 SMA @ 1.2435.
| Trends | Trends.1 | |
|---|---|---|
| 0 | Daily SMA20 | 1.2417 |
| 1 | Daily SMA50 | 1.2615 |
| 2 | Daily SMA100 | 1.2629 |
| 3 | Daily SMA200 | 1.2435 |
The previous day high was 1.2166 while the previous day low was 1.2111. The daily 38.2% Fib levels comes at 1.2132, expected to provide support. Similarly, the daily 61.8% fib level is at 1.2145, expected to provide resistance.
Note the levels of interest below:
- Pivot support is noted at 1.2108, 1.2082, 1.2053
- Pivot resistance is noted at 1.2164, 1.2193, 1.222
| Levels | Levels.1 |
|---|---|
| Previous Daily High | 1.2166 |
| Previous Daily Low | 1.2111 |
| Previous Weekly High | 1.2425 |
| Previous Weekly Low | 1.2231 |
| Previous Monthly High | 1.2841 |
| Previous Monthly Low | 1.2548 |
| Daily Fibonacci 38.2% | 1.2132 |
| Daily Fibonacci 61.8% | 1.2145 |
| Daily Pivot Point S1 | 1.2108 |
| Daily Pivot Point S2 | 1.2082 |
| Daily Pivot Point S3 | 1.2053 |
| Daily Pivot Point R1 | 1.2164 |
| Daily Pivot Point R2 | 1.2193 |
| Daily Pivot Point R3 | 1.2220 |
[/s2If]
Download Nehcap EAWe have two EAs that are operational on our LIVE accounts.
- EA-FIX: Check out the details here. Download EA-FIX . EA-FIX is a non-grid HFT scalper.
- EA-GROWTH: High quality low dd EA using trend grids. Download EA_GROWTHJoin Our Telegram Group
")


