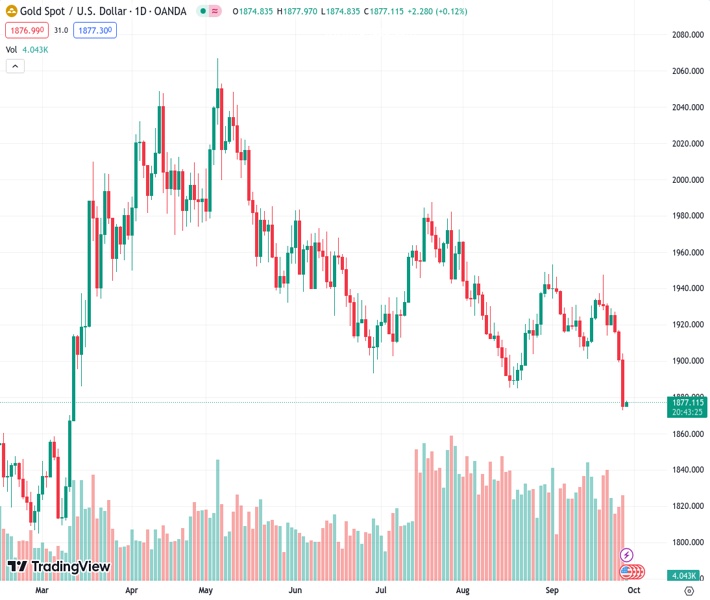
On Thursday, the gold price continues to drop, reaching $1,875.
…
This is a premium post.
[s2If !current_user_can(access_s2member_level4)]Please register for FREE REGISTER to read full post below containing analysis. In case of any error or you think you are not able to read the full post below, please email us at support#nehcap.com [lwa][/s2If] [s2If current_user_can(access_s2member_level1)]
- Gold price extends its downside around $1,875 on Thursday.
The pair currently trades last at 1877.00.
The previous day high was 1916.87 while the previous day low was 1899.25. The daily 38.2% Fib levels comes at 1905.98, expected to provide resistance. Similarly, the daily 61.8% fib level is at 1910.14, expected to provide resistance.
Gold price (XAU/USD) remains under selling pressure during the early European session on Thursday. The downtick of the precious metal is supported by the stronger US Dollar (USD) and higher Treasury yields. Gold price currently trades around $1,876, gaining 0.11% on the day.
Meanwhile, the US Dollar Index (DXY), a measure of the value of the USD relative to a basket of foreign currencies, surges above 106.65, the highest since November. US Treasury yields also edges higher with the 10-year Treasury yield settled at 4.60%, its highest level since 2007.
On Wednesday, the US Census Bureau reported that Durable Goods Orders for August rose by 0.2% MoM from a 5.6% drop in the previous reading, beating the expectations of a 0.5% fall MoM. Additionally, Durable Goods Orders ex Transportation climbed 0.4% MoM, a better than expected of 0.1% rise. Core capital goods orders grew 0.9% from the previous reading of a 0.4% drop, better than the estimation of 0%. Following the upbeat US data, the Greenback gains momentum across the board and exerts some pressure on USD-denominated Gold price.
Risk-averse sentiment dominated markets as investors weighed higher for longer rates narrative against growth risks from the possibility of an imminent government shutdown in the US. However, market participants will keep an eye on the Federal Reserve (Fed) Chair Jerome Powell’s speech this week. The less hawkish tone might cap the upside of the USD and lift the gold price.
On Thursday, market participants will monitor the US weekly Jobless Claims report, the third revision of Gross Domestic Product (GDP) for the second quarter, and Pending Home Sales data. The closely watched event will be the Fed’s preferred measure of consumer inflation, the Core Personal Consumption Expenditure (PCE) Price Index, scheduled for release on Friday. Traders will take cues from the data and find trading opportunities around gold price.
Technical Levels: Supports and Resistances
XAUUSD currently trading at 1877.68 at the time of writing. Pair opened at 1901.0 and is trading with a change of -1.23 % .
| Overview | Overview.1 | |
|---|---|---|
| 0 | Today last price | 1877.68 |
| 1 | Today Daily Change | -23.32 |
| 2 | Today Daily Change % | -1.23 |
| 3 | Today daily open | 1901.00 |
The pair remains strongly bearish on the daily time frame. It trades below the 20 SMA @ 1923.92, 50 SMA 1927.69, 100 SMA @ 1939.88 and 200 SMA @ 1926.76.
| Trends | Trends.1 | |
|---|---|---|
| 0 | Daily SMA20 | 1923.92 |
| 1 | Daily SMA50 | 1927.69 |
| 2 | Daily SMA100 | 1939.88 |
| 3 | Daily SMA200 | 1926.76 |
The previous day high was 1916.87 while the previous day low was 1899.25. The daily 38.2% Fib levels comes at 1905.98, expected to provide resistance. Similarly, the daily 61.8% fib level is at 1910.14, expected to provide resistance.
Note the levels of interest below:
- Pivot support is noted at 1894.54, 1888.09, 1876.92
- Pivot resistance is noted at 1912.16, 1923.33, 1929.78
| Levels | Levels.1 |
|---|---|
| Previous Daily High | 1916.87 |
| Previous Daily Low | 1899.25 |
| Previous Weekly High | 1947.47 |
| Previous Weekly Low | 1913.95 |
| Previous Monthly High | 1966.08 |
| Previous Monthly Low | 1884.85 |
| Daily Fibonacci 38.2% | 1905.98 |
| Daily Fibonacci 61.8% | 1910.14 |
| Daily Pivot Point S1 | 1894.54 |
| Daily Pivot Point S2 | 1888.09 |
| Daily Pivot Point S3 | 1876.92 |
| Daily Pivot Point R1 | 1912.16 |
| Daily Pivot Point R2 | 1923.33 |
| Daily Pivot Point R3 | 1929.78 |
[/s2If]
Download Nehcap EAWe have two EAs that are operational on our LIVE accounts.
- EA-FIX: Check out the details here. Download EA-FIX . EA-FIX is a non-grid HFT scalper.
- EA-GROWTH: High quality low dd EA using trend grids. Download EA_GROWTHJoin Our Telegram Group
")


