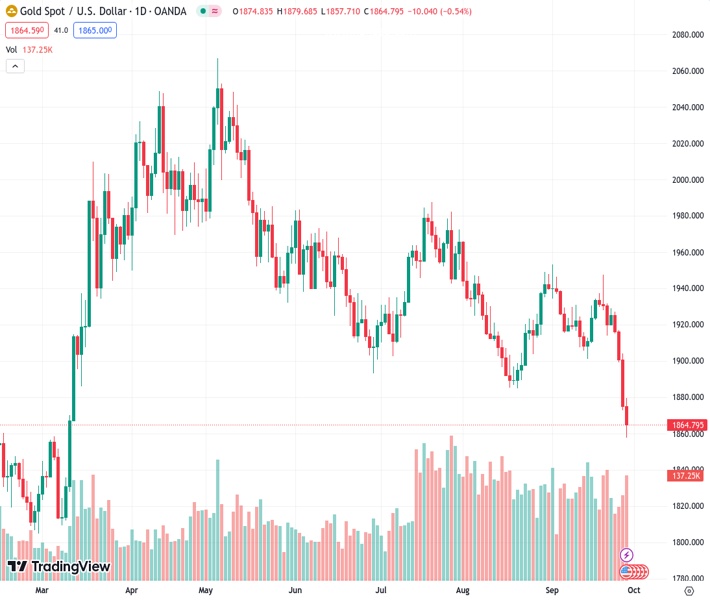
Gold spot, at a value of $1,864.95, has reduced its previous losses and is now being traded at $1,866.44. This is due to the decrease in US Treasury bond yields from their peak levels, leading to a weakened US dollar.
…
This is a premium post.
[s2If !current_user_can(access_s2member_level4)]Please register for FREE REGISTER to read full post below containing analysis. In case of any error or you think you are not able to read the full post below, please email us at support#nehcap.com [lwa][/s2If] [s2If current_user_can(access_s2member_level1)]
- Gold spot trims losses, trading at $1866.44, after US Treasury bond yields retract from multi-year highs, causing the USD to weaken.
The pair currently trades last at 1864.95.
The previous day high was 1904.13 while the previous day low was 1872.59. The daily 38.2% Fib levels comes at 1884.64, expected to provide resistance. Similarly, the daily 61.8% fib level is at 1892.08, expected to provide resistance.
Gold spot tumbles as Wall Street closes, but earlier printed a six-month low of $1857.82, as US Treasury bond yields skyrocketed, a headwind for the yellow metal. Nevertheless, the XAU/USD trimmed some of its losses as US bond yields retraced. At the time of writing, the non-yielding metal trades at $1866.44 after hitting a daily high of $1879.58, down 0.49%
Market sentiment improved on Thursday, while US Treasury bond yields retreated from multi-year highs of around 4.68% to 4.577%. Consequently, the Greenback (USD) is weakening, as portrayed by the US Dollar Index (DXY), down 0.49%, at 106.13.
Data in the United States (US) came as expected, particularly Gross Domestic Product (GDP) for Q2 on its final reading at 2.1%, aligned with the consensus but below the previous reading, which was upward revised to 2.2%. Inflation for the second quarter dropped to 1.7%, below the previous reading at 3.9%.
At the same time, the US Department of Labor revealed that Americans filing for unemployment on the week ending on September 23 rose by 204K, below estimates of 215K but more than last week’s 202K, portraying a robust labor market.
Aside from this, Federal Reserve officials continued to cross newswires. Chicago Fed’s President Austan Goolsbee said if the US central bank sees lack of progress on inflation, it would have to raise rates further while saying he’s not decided what to do at the next meeting. Meanwhile, Richmond’s Fed President Thomas Barkin stated the latest five months of inflation data have been encouraging, though he commented that it’s too soon to say what’s next on monetary policy.
After dropping to a new cycle low on Wednesday, Gold slumped below $1860, but it remains shy of the March 8 swing low at $1809.48. It should be said a death-cross in Gold’s daily chart, formed since Tuesday, cementing the XAU/USD bearish bias, but If it achieves a weekly close below $1900, that could exacerbate a drop to the latter and $1800. Otherwise, the yellow metal could pose a threat and test the 20-day moving average (DMA) at $1916.57
Technical Levels: Supports and Resistances
XAUUSD currently trading at 1864.45 at the time of writing. Pair opened at 1874.92 and is trading with a change of -0.56 % .
| Overview | Overview.1 | |
|---|---|---|
| 0 | Today last price | 1864.45 |
| 1 | Today Daily Change | -10.47 |
| 2 | Today Daily Change % | -0.56 |
| 3 | Today daily open | 1874.92 |
The pair remains strongly bearish on the daily time frame. It trades below the 20 SMA @ 1920.54, 50 SMA 1925.65, 100 SMA @ 1938.33 and 200 SMA @ 1927.04.
| Trends | Trends.1 | |
|---|---|---|
| 0 | Daily SMA20 | 1920.54 |
| 1 | Daily SMA50 | 1925.65 |
| 2 | Daily SMA100 | 1938.33 |
| 3 | Daily SMA200 | 1927.04 |
The previous day high was 1904.13 while the previous day low was 1872.59. The daily 38.2% Fib levels comes at 1884.64, expected to provide resistance. Similarly, the daily 61.8% fib level is at 1892.08, expected to provide resistance.
Note the levels of interest below:
- Pivot support is noted at 1863.63, 1852.34, 1832.09
- Pivot resistance is noted at 1895.17, 1915.42, 1926.71
| Levels | Levels.1 |
|---|---|
| Previous Daily High | 1904.13 |
| Previous Daily Low | 1872.59 |
| Previous Weekly High | 1947.47 |
| Previous Weekly Low | 1913.95 |
| Previous Monthly High | 1966.08 |
| Previous Monthly Low | 1884.85 |
| Daily Fibonacci 38.2% | 1884.64 |
| Daily Fibonacci 61.8% | 1892.08 |
| Daily Pivot Point S1 | 1863.63 |
| Daily Pivot Point S2 | 1852.34 |
| Daily Pivot Point S3 | 1832.09 |
| Daily Pivot Point R1 | 1895.17 |
| Daily Pivot Point R2 | 1915.42 |
| Daily Pivot Point R3 | 1926.71 |
[/s2If]
Download Nehcap EAWe have two EAs that are operational on our LIVE accounts.
- EA-FIX: Check out the details here. Download EA-FIX . EA-FIX is a non-grid HFT scalper.
- EA-GROWTH: High quality low dd EA using trend grids. Download EA_GROWTHJoin Our Telegram Group
")


