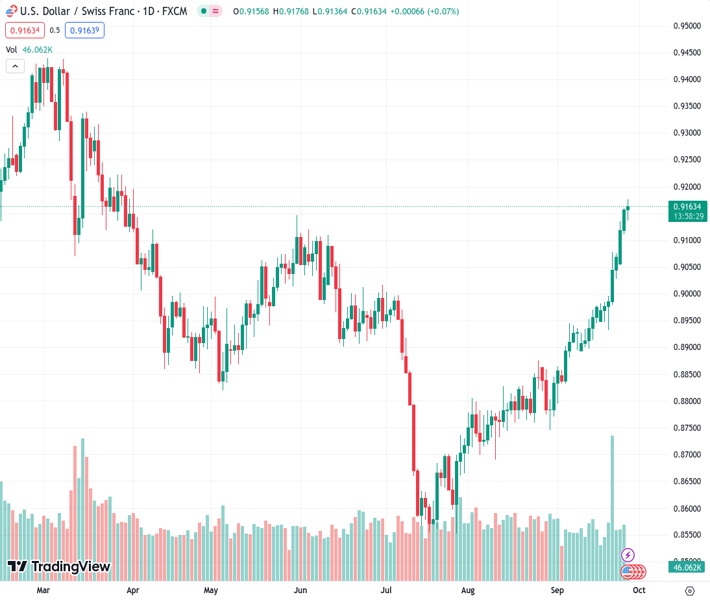
The USDCHF currency pair is showing increasing strength around the level of 0.9165, reaching its highest point since April.
…
This is a premium post.
[s2If !current_user_can(access_s2member_level4)]Please register for FREE REGISTER to read full post below containing analysis. In case of any error or you think you are not able to read the full post below, please email us at support#nehcap.com [lwa][/s2If] [s2If current_user_can(access_s2member_level1)]
- USD/CHF gains momentum around 0.9165, the highest since April.
The pair currently trades last at 0.91668.
The previous day high was 0.9159 while the previous day low was 0.9117. The daily 38.2% Fib levels comes at 0.9143, expected to provide support. Similarly, the daily 61.8% fib level is at 0.9133, expected to provide support.
The USD/CHF pair holds positive ground for seven straight days during the early European session on Wednesday. As of writing, USD/CHF is up 0.09% on the day at 0.9165. Market participants await the Swiss ZEW Survey and Swiss National Bank (SNB) Quarterly Bulletin on Wednesday for fresh impetus ahead of the US consumer inflation on Friday.
Technically, USD/CHF holds above the 50- and 100-hour Exponential Moving Averages (EMAs) with an upward slope on the four-hour chart. This indicates that the path of least resistance for the pair is to the upside. The Relative Strength Index (RSI) holds in bullish territory above 50. However, the overbought RSI condition indicates that further consolidation cannot be ruled out before positioning for any near-term USD/CHF appreciation.
The first resistance level for USD/CHF is located at 0.9200, representing a psychological round figure and a high of March 30. A break above the latter will see a rally to 0.9245 (a high of March 22) en route to 0.9300 (a high of March 17 and round figure).
Looking at the downside, a low of September 26 at 0.9128 acts as an initial support level for USD/CHF. Further south, the next stop is seen near the 50-hour EMA at 0.9053. Any intraday pullback below the latter would expose the next contention at 0.9035 (the lower limit of the Bollinger Band), followed by 0.8990 (the 100-hour EMA).
Technical Levels: Supports and Resistances
USDCHF currently trading at 0.9173 at the time of writing. Pair opened at 0.9158 and is trading with a change of 0.16 % .
| Overview | Overview.1 | |
|---|---|---|
| 0 | Today last price | 0.9173 |
| 1 | Today Daily Change | 0.0015 |
| 2 | Today Daily Change % | 0.1600 |
| 3 | Today daily open | 0.9158 |
The pair remains strongly bullish on the daily timeframe. It trades above its 20 SMA @ 0.895, 50 SMA 0.8828, 100 SMA @ 0.889 and 200 SMA @ 0.9033.
| Trends | Trends.1 | |
|---|---|---|
| 0 | Daily SMA20 | 0.8950 |
| 1 | Daily SMA50 | 0.8828 |
| 2 | Daily SMA100 | 0.8890 |
| 3 | Daily SMA200 | 0.9033 |
The previous day high was 0.9159 while the previous day low was 0.9117. The daily 38.2% Fib levels comes at 0.9143, expected to provide support. Similarly, the daily 61.8% fib level is at 0.9133, expected to provide support.
Note the levels of interest below:
- Pivot support is noted at 0.913, 0.9102, 0.9088
- Pivot resistance is noted at 0.9172, 0.9187, 0.9215
| Levels | Levels.1 |
|---|---|
| Previous Daily High | 0.9159 |
| Previous Daily Low | 0.9117 |
| Previous Weekly High | 0.9078 |
| Previous Weekly Low | 0.8932 |
| Previous Monthly High | 0.8876 |
| Previous Monthly Low | 0.8690 |
| Daily Fibonacci 38.2% | 0.9143 |
| Daily Fibonacci 61.8% | 0.9133 |
| Daily Pivot Point S1 | 0.9130 |
| Daily Pivot Point S2 | 0.9102 |
| Daily Pivot Point S3 | 0.9088 |
| Daily Pivot Point R1 | 0.9172 |
| Daily Pivot Point R2 | 0.9187 |
| Daily Pivot Point R3 | 0.9215 |
[/s2If]
Download Nehcap EAWe have two EAs that are operational on our LIVE accounts.
- EA-FIX: Check out the details here. Download EA-FIX . EA-FIX is a non-grid HFT scalper.
- EA-GROWTH: High quality low dd EA using trend grids. Download EA_GROWTHJoin Our Telegram Group
")


