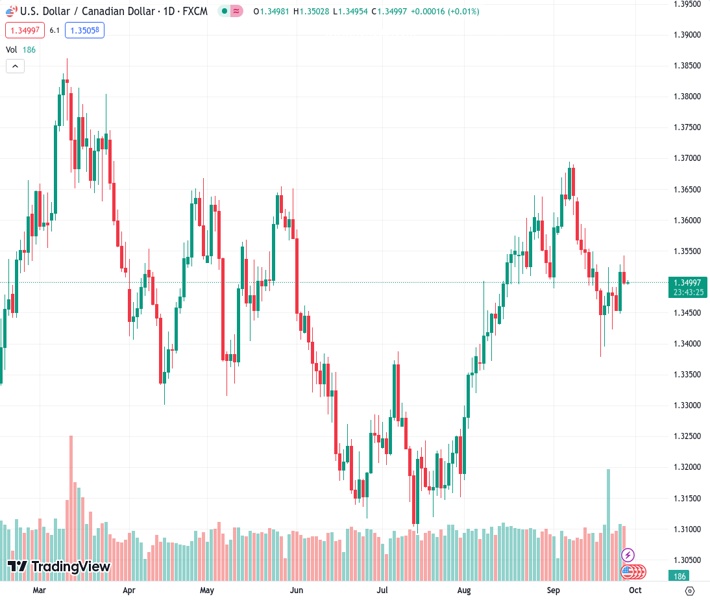
The USDCAD pair reached a high above 1.3540 but was unable to sustain this level and dropped back to finish Wednesday unchanged.
…
This is a premium post.
[s2If !current_user_can(access_s2member_level4)]Please register for FREE REGISTER to read full post below containing analysis. In case of any error or you think you are not able to read the full post below, please email us at support#nehcap.com [lwa][/s2If] [s2If current_user_can(access_s2member_level1)]
- The USD/CAD couldn’t hold onto highs above 1.3540, falling back to end Wednesday flat.
The pair currently trades last at 1.35000.
The previous day high was 1.3528 while the previous day low was 1.3449. The daily 38.2% Fib levels comes at 1.3498, expected to provide support. Similarly, the daily 61.8% fib level is at 1.3479, expected to provide support.
The USD/CAD kicked Wednesday off with a jump to 1.3543 as the US Dollar (USD) caught a broad-market bid on risk aversion and bumper US data, but soaring crude oil prices are sending the Loonie (CAD) higher and the USD/CAD is set to head into Thursday’s market session trading on the low end of the 1.3450 handle.
US data continues to beat expectations, with US Durable Goods Orders for August printing at 0.2% versus the forecast -0.5%. Up next for the US data docket will be Thursday’s Gross Domestic Product (GDP). US GDP for the second quarter is seen holding steady at the previous print of 2.1%.
Friday will see Canadian GDP figures for July forecast to rebound from -0.2% to 0.1%, while the US side sees Personal Consumption Expenditure (PCE) Price Index numbers, which the median market forecasts are expecting to hold steady at 0.2% for the month of August.
The US Dollar eventually lost the tug-of-war with the oil-bolstered Loonie, even as hawkish Fed officials and an impending government shutdown prop up the US Dollar Index (DXY) to fresh highs.
Crude oil prices are leaping up the charts as supply constraints continue to squeeze barrel costs to 13-month highs, and the upside fossil pressure was enough to keep CAD on-balance to send the USD/CAD back to the 1.3500 handle.
Read more:
Fed’s Kashkari: I am open to the possibility that we may need more than one hike
Forex Today: Dollar is the only safe haven in town, Oil soars
The USD/CAD is getting pinned to the 34-day Exponential Moving Average (EMA) on daily candles, and the pair is at risk of falling back to the 200-day Simple Moving Average (SMA) just north of 1.3450.
The pair is still up 3% from the last swing low into the 1.3100 handle.
On the hourly candlesticks, a continued backslide will see the pair testing the 200-hour SMA near 1.3480, with technical support coming from a rising trendline from last week’s swing lows near 1.3430 and 1.3450.
Technical Levels: Supports and Resistances
USDCAD currently trading at 1.3498 at the time of writing. Pair opened at 1.3517 and is trading with a change of -0.14 % .
| Overview | Overview.1 | |
|---|---|---|
| 0 | Today last price | 1.3498 |
| 1 | Today Daily Change | -0.0019 |
| 2 | Today Daily Change % | -0.1400 |
| 3 | Today daily open | 1.3517 |
The pair is trading below its 20 Daily moving average @ 1.3543, above its 50 Daily moving average @ 1.3453 , above its 100 Daily moving average @ 1.3402 and above its 200 Daily moving average @ 1.346
| Trends | Trends.1 | |
|---|---|---|
| 0 | Daily SMA20 | 1.3543 |
| 1 | Daily SMA50 | 1.3453 |
| 2 | Daily SMA100 | 1.3402 |
| 3 | Daily SMA200 | 1.3460 |
The previous day high was 1.3528 while the previous day low was 1.3449. The daily 38.2% Fib levels comes at 1.3498, expected to provide support. Similarly, the daily 61.8% fib level is at 1.3479, expected to provide support.
Note the levels of interest below:
- Pivot support is noted at 1.3468, 1.3419, 1.3389
- Pivot resistance is noted at 1.3547, 1.3577, 1.3626
| Levels | Levels.1 |
|---|---|
| Previous Daily High | 1.3528 |
| Previous Daily Low | 1.3449 |
| Previous Weekly High | 1.3528 |
| Previous Weekly Low | 1.3379 |
| Previous Monthly High | 1.3640 |
| Previous Monthly Low | 1.3184 |
| Daily Fibonacci 38.2% | 1.3498 |
| Daily Fibonacci 61.8% | 1.3479 |
| Daily Pivot Point S1 | 1.3468 |
| Daily Pivot Point S2 | 1.3419 |
| Daily Pivot Point S3 | 1.3389 |
| Daily Pivot Point R1 | 1.3547 |
| Daily Pivot Point R2 | 1.3577 |
| Daily Pivot Point R3 | 1.3626 |
[/s2If]
Download Nehcap EAWe have two EAs that are operational on our LIVE accounts.
- EA-FIX: Check out the details here. Download EA-FIX . EA-FIX is a non-grid HFT scalper.
- EA-GROWTH: High quality low dd EA using trend grids. Download EA_GROWTHJoin Our Telegram Group
")


