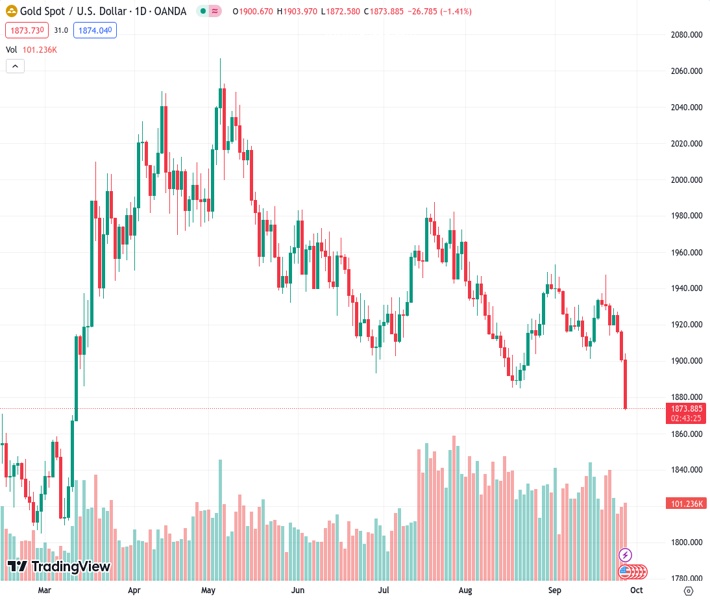
The price of gold, represented by the symbol XAUUSD, has dropped by over 1% and reached a new low of less than $1884.89.
…
This is a premium post.
[s2If !current_user_can(access_s2member_level4)]Please register for FREE REGISTER to read full post below containing analysis. In case of any error or you think you are not able to read the full post below, please email us at support#nehcap.com [lwa][/s2If] [s2If current_user_can(access_s2member_level1)]
- Gold price plunges more than 1%, drafting a new cycle low below $1884.89.
The pair currently trades last at 1873.22.
The previous day high was 1916.87 while the previous day low was 1899.25. The daily 38.2% Fib levels comes at 1905.98, expected to provide resistance. Similarly, the daily 61.8% fib level is at 1910.14, expected to provide resistance.
Gold price plunged more than 1% in the mid-New York session, drafting a new cycle low below the August 21 swing low of $1884.89, as sellers set their eyes to March 2023 low levels at around $1800. At the time of writing, XAU/USD is trading at $1875 after hitting a daily high of $s1903.98.
Risk aversion and elevated US bond yields keep XAU/USD under pressure. US Treasury bond yields continued to climb, with the 10-year benchmark note rates last seen at 4.63%, gaining 1.90%, while fears of the US Federal Government shutdown, which could furlough millions of federal employees next Saturday, added another reason to the already sour sentiment.
In the meantime, the Minnesota Fed President Neil Kashkari continued his parade on Wednesday, noting he’s unsure if the Federal Reserve is restrictive enough and suggested that another rate hike is needed. He added he’s expecting the US central bank to keep rates “steady” while keeping the door open for more than one hike, Kashkari said recently in an interview with Fox Business.
Earlier, the US economic docket revealed that US Durable Goods Orders for August increased more than expected, at 0.2% MoM, with estimates for a -0.2% drop; excluding Transports, the so-called core, came at 0.4% MoM, above estimates and the previous month 0.1% expansion.
XAU/USD traders would take additional cues from US economic releases. The calendar will feature the final revision of Q2’s Gross Domestic Product (GDP), Pending Home Sales, Initial Jobless Claims, and Fed speakers on Thursday. By Friday, the Fed’s preferred gauge for inflation, the Core PCE would be announced.
Gold’s daily chart portrays the non-yielding metal extending its losses toward the March 8 low of $1809.48. If that level is cleared, the yellow metal could test the year-to-date (YTD) lows at around $1804.78. Once that level is surpassed, XAU/USD’s next support would emerge at the November 15, 2022, daily high at $1786.53. Conversely, if XAU/USD reclaims $1884.89, the first resistance would be $1900.
Technical Levels: Supports and Resistances
XAUUSD currently trading at 1874.81 at the time of writing. Pair opened at 1901.0 and is trading with a change of -1.38 % .
| Overview | Overview.1 | |
|---|---|---|
| 0 | Today last price | 1874.81 |
| 1 | Today Daily Change | -26.19 |
| 2 | Today Daily Change % | -1.38 |
| 3 | Today daily open | 1901.00 |
The pair remains strongly bearish on the daily time frame. It trades below the 20 SMA @ 1923.92, 50 SMA 1927.69, 100 SMA @ 1939.88 and 200 SMA @ 1926.76.
| Trends | Trends.1 | |
|---|---|---|
| 0 | Daily SMA20 | 1923.92 |
| 1 | Daily SMA50 | 1927.69 |
| 2 | Daily SMA100 | 1939.88 |
| 3 | Daily SMA200 | 1926.76 |
The previous day high was 1916.87 while the previous day low was 1899.25. The daily 38.2% Fib levels comes at 1905.98, expected to provide resistance. Similarly, the daily 61.8% fib level is at 1910.14, expected to provide resistance.
Note the levels of interest below:
- Pivot support is noted at 1894.54, 1888.09, 1876.92
- Pivot resistance is noted at 1912.16, 1923.33, 1929.78
| Levels | Levels.1 |
|---|---|
| Previous Daily High | 1916.87 |
| Previous Daily Low | 1899.25 |
| Previous Weekly High | 1947.47 |
| Previous Weekly Low | 1913.95 |
| Previous Monthly High | 1966.08 |
| Previous Monthly Low | 1884.85 |
| Daily Fibonacci 38.2% | 1905.98 |
| Daily Fibonacci 61.8% | 1910.14 |
| Daily Pivot Point S1 | 1894.54 |
| Daily Pivot Point S2 | 1888.09 |
| Daily Pivot Point S3 | 1876.92 |
| Daily Pivot Point R1 | 1912.16 |
| Daily Pivot Point R2 | 1923.33 |
| Daily Pivot Point R3 | 1929.78 |
[/s2If]
Download Nehcap EAWe have two EAs that are operational on our LIVE accounts.
- EA-FIX: Check out the details here. Download EA-FIX . EA-FIX is a non-grid HFT scalper.
- EA-GROWTH: High quality low dd EA using trend grids. Download EA_GROWTHJoin Our Telegram Group
")


