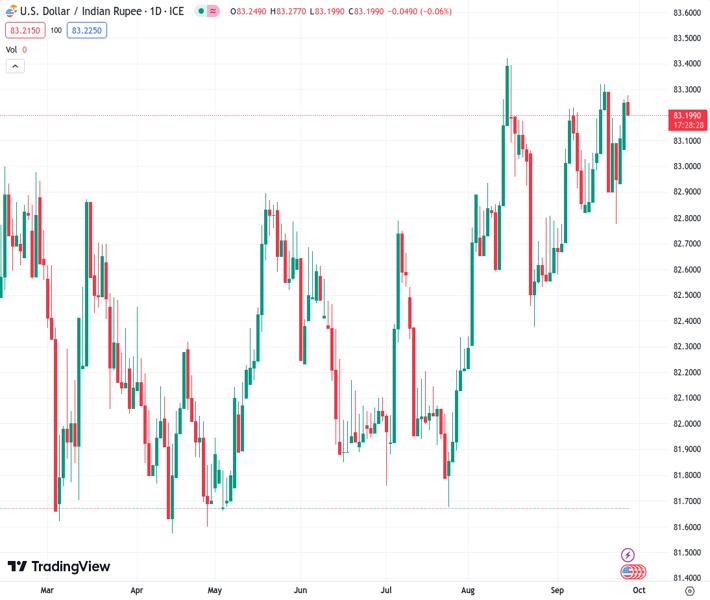
The pairing of US Dollar and Indian Rupee at a rate of 83.2080 is experiencing stability after experiencing gains over the week, but still below the highest point achieved this month.
…
This is a premium post.
[s2If !current_user_can(access_s2member_level4)]Please register for FREE REGISTER to read full post below containing analysis. In case of any error or you think you are not able to read the full post below, please email us at support#nehcap.com [lwa][/s2If] [s2If current_user_can(access_s2member_level1)]
- USD/INR consolidates its weekly gains and remains below the monthly swing peak.
The pair currently trades last at 83.2080.
The previous day high was 83.4279 while the previous day low was 82.8855. The daily 38.2% Fib levels comes at 83.2207, expected to provide resistance. Similarly, the daily 61.8% fib level is at 83.0926, expected to provide support.
The USD/INR pair struggles to capitalize on its gains registered over the past two days and oscillates in a narrow trading band through the Asian session on Wednesday. Spot prices currently trade just below the monthly peak, around the 83.30-83.35 region touched last week, which should now act as a key pivotal point for short-term traders.
The US Dollar (USD) advances to a fresh 10-month high in the wake of growing acceptance that the Federal Reserve (Fed) will keep rates higher for longer, which remains supportive of elevated US Treasury bond yields. Apart from this, a weaker risk tone further benefits the Greenback’s relative safe-haven status and should act as a tailwind for the USD/INR pair.
From a technical perspective, spot prices are holding comfortably above technically significant 100-day and 200-day Simple Moving Averages (SMAs). Furthermore, oscillators on the daily chart have just started moving in the positive territory and favour bullish traders. That said, it will still be prudent to wait for some follow-through buying before positioning for further gains.
The USD/INR pair might then aim to surpass the all-time peak, around the 82.83.40-83.45 region touched on August 15, and conquer the 84.00 round-figure mark.
On the flip side, any corrective decline might now find support near the 83.00 mark ahead of last Friday’s swing low, around the 82.80-82.75 zone. This is closely followed by the upward-sloping 100-day SMA, near the mid-82.00s, and the 200-day SMA, around the 82.35 region. A convincing break below the latter will shift the bias in favour of bears and make the USD/INR pair vulnerable.
Spot prices might then accelerate the downward trajectory towards the 82.00 mark before eventually dropping to the July swing low, around the 81.70-81.65 region.
Technical Levels: Supports and Resistances
USDINR currently trading at 83.2365 at the time of writing. Pair opened at 83.4188 and is trading with a change of -0.22 % .
| Overview | Overview.1 | |
|---|---|---|
| 0 | Today last price | 83.2365 |
| 1 | Today Daily Change | -0.1823 |
| 2 | Today Daily Change % | -0.2200 |
| 3 | Today daily open | 83.4188 |
The pair remains strongly bullish on the daily timeframe. It trades above its 20 SMA @ 83.0507, 50 SMA 82.8091, 100 SMA @ 82.5598 and 200 SMA @ 82.3675.
| Trends | Trends.1 | |
|---|---|---|
| 0 | Daily SMA20 | 83.0507 |
| 1 | Daily SMA50 | 82.8091 |
| 2 | Daily SMA100 | 82.5598 |
| 3 | Daily SMA200 | 82.3675 |
The previous day high was 83.4279 while the previous day low was 82.8855. The daily 38.2% Fib levels comes at 83.2207, expected to provide resistance. Similarly, the daily 61.8% fib level is at 83.0926, expected to provide support.
Note the levels of interest below:
- Pivot support is noted at 83.0602, 82.7016, 82.5178
- Pivot resistance is noted at 83.6026, 83.7864, 84.145
| Levels | Levels.1 |
|---|---|
| Previous Daily High | 83.4279 |
| Previous Daily Low | 82.8855 |
| Previous Weekly High | 83.8456 |
| Previous Weekly Low | 82.5125 |
| Previous Monthly High | 83.5505 |
| Previous Monthly Low | 82.2240 |
| Daily Fibonacci 38.2% | 83.2207 |
| Daily Fibonacci 61.8% | 83.0926 |
| Daily Pivot Point S1 | 83.0602 |
| Daily Pivot Point S2 | 82.7016 |
| Daily Pivot Point S3 | 82.5178 |
| Daily Pivot Point R1 | 83.6026 |
| Daily Pivot Point R2 | 83.7864 |
| Daily Pivot Point R3 | 84.1450 |
[/s2If]
Download Nehcap EAWe have two EAs that are operational on our LIVE accounts.
- EA-FIX: Check out the details here. Download EA-FIX . EA-FIX is a non-grid HFT scalper.
- EA-GROWTH: High quality low dd EA using trend grids. Download EA_GROWTHJoin Our Telegram Group
")


