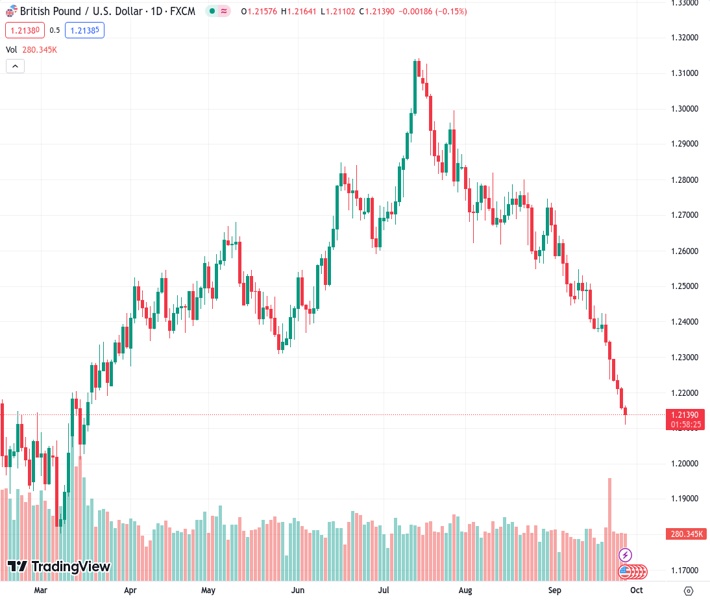
The GBPUSD exchange rate, currently at 1.21407, is witnessing a continued decline as the Pound Sterling loses more ground against the US Dollar.
…
This is a premium post.
[s2If !current_user_can(access_s2member_level4)]Please register for FREE REGISTER to read full post below containing analysis. In case of any error or you think you are not able to read the full post below, please email us at support#nehcap.com [lwa][/s2If] [s2If current_user_can(access_s2member_level1)]
- The GBP/USD continues to backslide as the Pound Sterling weakens further against the Greenback.
The pair currently trades last at 1.21407.
The previous day high was 1.2216 while the previous day low was 1.2153. The daily 38.2% Fib levels comes at 1.2177, expected to provide resistance. Similarly, the daily 61.8% fib level is at 1.2192, expected to provide resistance.
The GBP/USD continues to slip around below the 1.2160 cap on Wednesday trading, dipping to a session low of 1.2110 as selling pressure looks to crack the 1.2100 handle heading into the latter half of the trading week.
A late-day rebound for the Pound Sterling (GBP) is seeing the pair stage a mild pullback to 1.2140, but USD strength continues to remain a key driver in broader markets for the day.
US Durable Goods Orders broadly beat expectations on Wednesday, printing at 0.2% and clearing the -0.5% forecast. Thursday will bring US Gross Domestic Product (GDP) numbers, which markets are forecasting to print steady at 2.1%.
The GBP/USD will see some of the week’s highest investor focus with the UK’s GDP for the second quarter, which is expected to stay in-line with the previous reading of 0.2%, but Friday’s action will likely be overshadowed by the US Personal Consumption Expenditure (PCE) Price Index.
US PCE inflation is forecast to print steady at 0.2% for the month of August, with the annualized figure slipping from 4.2% to 3.9% for the same period.
The GBP/USD is firmly embedded deep in bearish territory, and the pair is down over 4% in September alone.
The Pound Sterling is steadily trading into six-month lows against the Greenback, and the next significant technical support zone sits at March’s low near 1.1800.
Technical indicators are buried deep into oversold territory, with the Relative Strength Index (RSI) indicator at its lowest values on a 14-day rolling timetable since 2022’s September declines into 1.0840.
The 200-day Simple Moving Average (SMA) currently sits north of 1.2400, and the 34-day Exponential Moving Average (EMA) has turned down sharply, and is set to make a bearish cross of the longer MA.
Technical Levels: Supports and Resistances
GBPUSD currently trading at 1.2141 at the time of writing. Pair opened at 1.2159 and is trading with a change of -0.15 % .
| Overview | Overview.1 | |
|---|---|---|
| 0 | Today last price | 1.2141 |
| 1 | Today Daily Change | -0.0018 |
| 2 | Today Daily Change % | -0.1500 |
| 3 | Today daily open | 1.2159 |
The pair remains strongly bearish on the daily time frame. It trades below the 20 SMA @ 1.2447, 50 SMA 1.2631, 100 SMA @ 1.2634 and 200 SMA @ 1.2434.
| Trends | Trends.1 | |
|---|---|---|
| 0 | Daily SMA20 | 1.2447 |
| 1 | Daily SMA50 | 1.2631 |
| 2 | Daily SMA100 | 1.2634 |
| 3 | Daily SMA200 | 1.2434 |
The previous day high was 1.2216 while the previous day low was 1.2153. The daily 38.2% Fib levels comes at 1.2177, expected to provide resistance. Similarly, the daily 61.8% fib level is at 1.2192, expected to provide resistance.
Note the levels of interest below:
- Pivot support is noted at 1.2136, 1.2113, 1.2073
- Pivot resistance is noted at 1.2199, 1.2238, 1.2261
| Levels | Levels.1 |
|---|---|
| Previous Daily High | 1.2216 |
| Previous Daily Low | 1.2153 |
| Previous Weekly High | 1.2425 |
| Previous Weekly Low | 1.2231 |
| Previous Monthly High | 1.2841 |
| Previous Monthly Low | 1.2548 |
| Daily Fibonacci 38.2% | 1.2177 |
| Daily Fibonacci 61.8% | 1.2192 |
| Daily Pivot Point S1 | 1.2136 |
| Daily Pivot Point S2 | 1.2113 |
| Daily Pivot Point S3 | 1.2073 |
| Daily Pivot Point R1 | 1.2199 |
| Daily Pivot Point R2 | 1.2238 |
| Daily Pivot Point R3 | 1.2261 |
[/s2If]
Download Nehcap EAWe have two EAs that are operational on our LIVE accounts.
- EA-FIX: Check out the details here. Download EA-FIX . EA-FIX is a non-grid HFT scalper.
- EA-GROWTH: High quality low dd EA using trend grids. Download EA_GROWTHJoin Our Telegram Group
")


