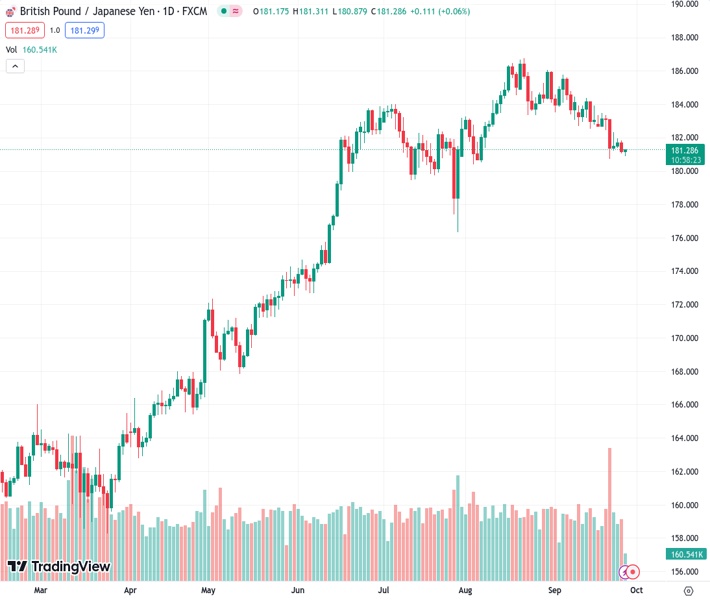
The GBPJPY currency pair, currently trading at 181.289, is expected to encounter a moderate level of support around 181.00, suggesting that there is a higher likelihood of a downward movement.
…
This is a premium post.
[s2If !current_user_can(access_s2member_level4)]Please register for FREE REGISTER to read full post below containing analysis. In case of any error or you think you are not able to read the full post below, please email us at support#nehcap.com [lwa][/s2If] [s2If current_user_can(access_s2member_level1)]
- GBP/JPY finds an intermediate support near 181.00 while the downside seems favored.
The pair currently trades last at 181.289.
The previous day high was 181.87 while the previous day low was 181.05. The daily 38.2% Fib levels comes at 181.37, expected to provide resistance. Similarly, the daily 61.8% fib level is at 181.56, expected to provide resistance.
The GBP/JPY pair discovers some buying interest near 181.00 after remaining under selling pressure from the past few trading sessions. The asset may continue its downside trend the policy divergence between the Bank of England (BoE) and the Bank of Japan (BoJ) would not widen further on expectations that the former is done with hiking interest rates.
The BoE announced a steady interest rate decision last week as higher interest rates are threatening the economic outlook. The United Kingdom’s labor market has lost its resilience as the jobless rate is rising moderately and fresh demand for labor has eased.
Meanwhile, fears of a stealth intervention by the Bank of Japan (BoJ) in the FX domain to defend further downside in the Japanese Yen may keep the asset under pressure.
This week, investors will focus on the UK’s April-June quarter Gross Domestic Product (GDP) data, which will be published on Friday. UK’s GDP is foreseen to expand at a steady pace of 0.2% and 0.4% respectively.
GBP/JPY drops after testing the breakdown region of the Symmetrical Triangle chart pattern formed on a two-hour scale. A breakdown of the aforementioned chart pattern results in wider ticks on the downside and heavy selling volume. The asset is trading below the 200-period Exponential Moving Average (EMA), which indicates that the broader trend is bearish.
The Relative Strength Index (RSI) (14) shifts into the bearish range of 20.00-40.00, which indicates that the bearish impulse is active.
Going forward, a breakdown below September 21 low at 180.82 would drag the asset further toward July 20 low at 179.74 and July 26 low at 176.32.
On the flip side, a recovery move above September 19 high at 183.50 would drive the asset toward September 5 high at 185.75, followed by August 22 high at 186.77.
Technical Levels: Supports and Resistances
GBPJPY currently trading at 181.09 at the time of writing. Pair opened at 181.28 and is trading with a change of -0.1 % .
| Overview | Overview.1 | |
|---|---|---|
| 0 | Today last price | 181.09 |
| 1 | Today Daily Change | -0.19 |
| 2 | Today Daily Change % | -0.10 |
| 3 | Today daily open | 181.28 |
The pair is trading below its 20 Daily moving average @ 183.52, below its 50 Daily moving average @ 183.28 , above its 100 Daily moving average @ 180.29 and above its 200 Daily moving average @ 171.41
| Trends | Trends.1 | |
|---|---|---|
| 0 | Daily SMA20 | 183.52 |
| 1 | Daily SMA50 | 183.28 |
| 2 | Daily SMA100 | 180.29 |
| 3 | Daily SMA200 | 171.41 |
The previous day high was 181.87 while the previous day low was 181.05. The daily 38.2% Fib levels comes at 181.37, expected to provide resistance. Similarly, the daily 61.8% fib level is at 181.56, expected to provide resistance.
Note the levels of interest below:
- Pivot support is noted at 180.93, 180.58, 180.11
- Pivot resistance is noted at 181.75, 182.22, 182.57
| Levels | Levels.1 |
|---|---|
| Previous Daily High | 181.87 |
| Previous Daily Low | 181.05 |
| Previous Weekly High | 183.49 |
| Previous Weekly Low | 180.82 |
| Previous Monthly High | 186.77 |
| Previous Monthly Low | 180.46 |
| Daily Fibonacci 38.2% | 181.37 |
| Daily Fibonacci 61.8% | 181.56 |
| Daily Pivot Point S1 | 180.93 |
| Daily Pivot Point S2 | 180.58 |
| Daily Pivot Point S3 | 180.11 |
| Daily Pivot Point R1 | 181.75 |
| Daily Pivot Point R2 | 182.22 |
| Daily Pivot Point R3 | 182.57 |
[/s2If]
Download Nehcap EAWe have two EAs that are operational on our LIVE accounts.
- EA-FIX: Check out the details here. Download EA-FIX . EA-FIX is a non-grid HFT scalper.
- EA-GROWTH: High quality low dd EA using trend grids. Download EA_GROWTHJoin Our Telegram Group
")


