The Euro’s decline is gaining momentum in all markets.
…
This is a premium post.
[s2If !current_user_can(access_s2member_level4)]Please register for FREE REGISTER to read full post below containing analysis. In case of any error or you think you are not able to read the full post below, please email us at support#nehcap.com [lwa][/s2If] [s2If current_user_can(access_s2member_level1)]
- The Euro accelerates its decline across the board.
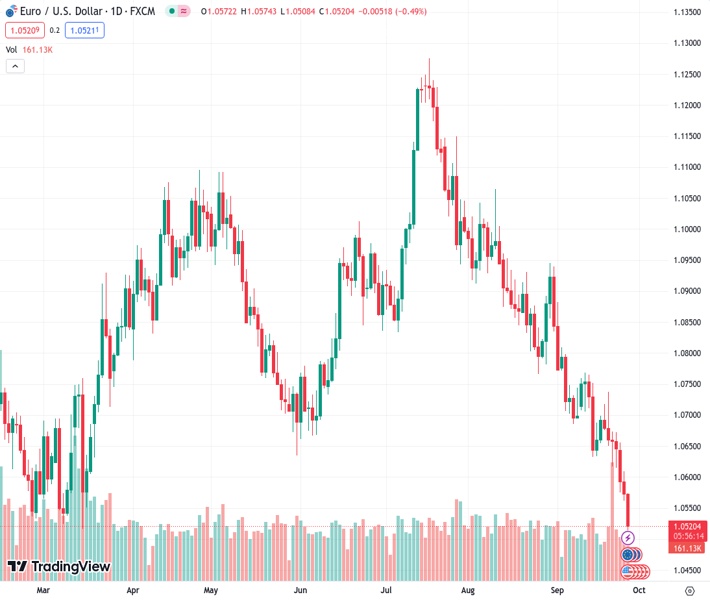
The pair currently trades last at 1.05116.
The previous day high was 1.0609 while the previous day low was 1.0562. The daily 38.2% Fib levels comes at 1.058, expected to provide resistance. Similarly, the daily 61.8% fib level is at 1.0591, expected to provide resistance.
The EUR/USD pair accelerated its decline after the beginning of the Asian session and dropped to 1.0509, reaching the lowest level since January. It remains near these lows, under pressure, as the US Dollar continues to hold firm, extending its rally.
The EUR/USD broke below 1.0530, and the decline gained momentum, with the pair now targeting the 1.0500 area. Below, the next level to watch is the year-to-date low at 1.0483.
The negative momentum of the Euro has intensified, without a particular catalyst driving the decline in the past few hours. EUR/GBP has retreated from 0.8700 to 0.8660, while EUR/CHF is reversing from two-month highs. EUR/JPY is also falling, approaching 147.00.
On the other hand, despite being up for the fourth consecutive day, the US Dollar Index (DXY) maintains its momentum. It reached a fresh 2023 high at 106.64. The Greenback continues to be supported by US Treasury yields and market sentiment. Stocks in Wall Street opened positively but quickly trimmed their gains after the initial surge.
US data came in above expectations, with Durable Goods Orders rising by 0.2% in August, contrary to expectations of a 0.2% decline. German and Spanish inflation data are due on Thursday.
Technical Levels: Supports and Resistances
EURUSD currently trading at 1.0518 at the time of writing. Pair opened at 1.0573 and is trading with a change of -0.52 % .
| Overview | Overview.1 | |
|---|---|---|
| 0 | Today last price | 1.0518 |
| 1 | Today Daily Change | -0.0055 |
| 2 | Today Daily Change % | -0.5200 |
| 3 | Today daily open | 1.0573 |
The pair remains strongly bearish on the daily time frame. It trades below the 20 SMA @ 1.0711, 50 SMA 1.0859, 100 SMA @ 1.0869 and 200 SMA @ 1.083.
| Trends | Trends.1 | |
|---|---|---|
| 0 | Daily SMA20 | 1.0711 |
| 1 | Daily SMA50 | 1.0859 |
| 2 | Daily SMA100 | 1.0869 |
| 3 | Daily SMA200 | 1.0830 |
The previous day high was 1.0609 while the previous day low was 1.0562. The daily 38.2% Fib levels comes at 1.058, expected to provide resistance. Similarly, the daily 61.8% fib level is at 1.0591, expected to provide resistance.
Note the levels of interest below:
- Pivot support is noted at 1.0554, 1.0534, 1.0507
- Pivot resistance is noted at 1.0601, 1.0628, 1.0648
| Levels | Levels.1 |
|---|---|
| Previous Daily High | 1.0609 |
| Previous Daily Low | 1.0562 |
| Previous Weekly High | 1.0737 |
| Previous Weekly Low | 1.0615 |
| Previous Monthly High | 1.1065 |
| Previous Monthly Low | 1.0766 |
| Daily Fibonacci 38.2% | 1.0580 |
| Daily Fibonacci 61.8% | 1.0591 |
| Daily Pivot Point S1 | 1.0554 |
| Daily Pivot Point S2 | 1.0534 |
| Daily Pivot Point S3 | 1.0507 |
| Daily Pivot Point R1 | 1.0601 |
| Daily Pivot Point R2 | 1.0628 |
| Daily Pivot Point R3 | 1.0648 |
[/s2If]
Download Nehcap EAWe have two EAs that are operational on our LIVE accounts.
- EA-FIX: Check out the details here. Download EA-FIX . EA-FIX is a non-grid HFT scalper.
- EA-GROWTH: High quality low dd EA using trend grids. Download EA_GROWTHJoin Our Telegram Group
")


