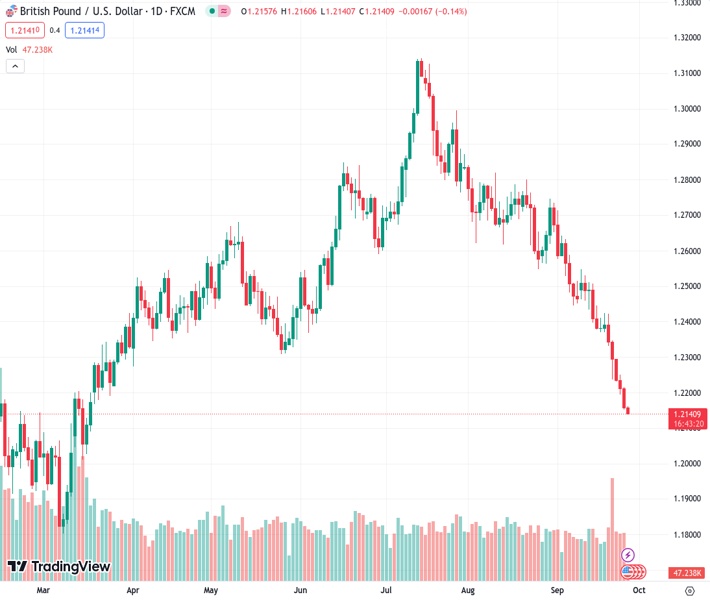
The British pound to US dollar exchange rate, at a rate of 1.21407, experiences a decline due to positive economic data coming out of the United States on Tuesday.
…
This is a premium post.
[s2If !current_user_can(access_s2member_level4)]Please register for FREE REGISTER to read full post below containing analysis. In case of any error or you think you are not able to read the full post below, please email us at support#nehcap.com [lwa][/s2If] [s2If current_user_can(access_s2member_level1)]
- GBP/USD weakens on upbeat US macro data released on Tuesday.
The pair currently trades last at 1.21407.
The previous day high was 1.2216 while the previous day low was 1.2153. The daily 38.2% Fib levels comes at 1.2177, expected to provide resistance. Similarly, the daily 61.8% fib level is at 1.2192, expected to provide resistance.
GBP/USD continues the losing streak that began on September 20, trading below 1.2150 during the Asian session on Wednesday. Upbeat economic data from the United States (US) reinforces the prevailing pressure on the pair.
US Consumer Confidence released on Tuesday for September declined to 103.0 from the previous reading of 108.7 in August. While Building Permits rose to 1.541M in August from 1.443M prior.
Moreover, the House Price Index (MoM) for July climbed to 0.8% compared to the market expectations of 0.5% from the previous rate of 0.4%.
Additionally, the Federal Reserve’s (Fed) hawkish stance on the interest rate trajectory keeps pushing the US Treasury yields, which is boosting the US Dollar (USD). The yield on the 10-year US Treasury note retreats from the highest level since October 2007, and hovers near 4.51% at the time of writing.
Furthermore, traders await the US Durable Goods Orders report to be released on Wednesday. Core Personal Consumption Expenditure (PCE) Price Index, the Fed’s preferred measure of consumer inflation, is due on Friday. The annual rate is anticipated to reduce from 4.2% to 3.9%.
The US Dollar Index (DXY) trades around 106.30 by the press time, the highest level since December.
On Tuesday, Minnesota Fed President Neel Kashkari expressed the view that another rate hike is necessary, followed by the need to maintain rates at that level. He also mentioned the possibility of achieving a soft landing for the economy, which implies a gradual slowdown without causing a recession.
Recently, various Federal Reserve officials have offered differing perspectives on monetary policy. Some have advocated for patience, while others, such as Fed Governor Bowman, have emphasized the need for another interest rate hike.
Considering the latest “dot plots” presented in the September Summary of Economic Projections (SEP), it appears that the Fed is projecting a 25 basis point (bps) rate hike toward the end of the year. Furthermore, the Fed anticipates keeping rates above the 5% threshold throughout the following year.
On the United Kingdom’s (UK) side, traders are heavily reliant on the most recent decision from the Bank of England (BoE) in the absence of economic data, which was perceived as dovish. This perception was influenced by an inflation report indicating a cooling down of inflationary pressures.
However, the latest economic data from the UK, notably softer retail sales, and PMIs (Purchasing Managers’ Index) has revived concerns of a potential recession. Upcoming UK’s Gross Domestic Product (GDP) data will be eyed on Friday, which is expected to remain consistent.
Technical Levels: Supports and Resistances
GBPUSD currently trading at 1.2147 at the time of writing. Pair opened at 1.2159 and is trading with a change of -0.1 % .
| Overview | Overview.1 | |
|---|---|---|
| 0 | Today last price | 1.2147 |
| 1 | Today Daily Change | -0.0012 |
| 2 | Today Daily Change % | -0.1000 |
| 3 | Today daily open | 1.2159 |
The pair remains strongly bearish on the daily time frame. It trades below the 20 SMA @ 1.2447, 50 SMA 1.2631, 100 SMA @ 1.2634 and 200 SMA @ 1.2434.
| Trends | Trends.1 | |
|---|---|---|
| 0 | Daily SMA20 | 1.2447 |
| 1 | Daily SMA50 | 1.2631 |
| 2 | Daily SMA100 | 1.2634 |
| 3 | Daily SMA200 | 1.2434 |
The previous day high was 1.2216 while the previous day low was 1.2153. The daily 38.2% Fib levels comes at 1.2177, expected to provide resistance. Similarly, the daily 61.8% fib level is at 1.2192, expected to provide resistance.
Note the levels of interest below:
- Pivot support is noted at 1.2136, 1.2113, 1.2073
- Pivot resistance is noted at 1.2199, 1.2238, 1.2261
| Levels | Levels.1 |
|---|---|
| Previous Daily High | 1.2216 |
| Previous Daily Low | 1.2153 |
| Previous Weekly High | 1.2425 |
| Previous Weekly Low | 1.2231 |
| Previous Monthly High | 1.2841 |
| Previous Monthly Low | 1.2548 |
| Daily Fibonacci 38.2% | 1.2177 |
| Daily Fibonacci 61.8% | 1.2192 |
| Daily Pivot Point S1 | 1.2136 |
| Daily Pivot Point S2 | 1.2113 |
| Daily Pivot Point S3 | 1.2073 |
| Daily Pivot Point R1 | 1.2199 |
| Daily Pivot Point R2 | 1.2238 |
| Daily Pivot Point R3 | 1.2261 |
[/s2If]
Download Nehcap EAWe have two EAs that are operational on our LIVE accounts.
- EA-FIX: Check out the details here. Download EA-FIX . EA-FIX is a non-grid HFT scalper.
- EA-GROWTH: High quality low dd EA using trend grids. Download EA_GROWTHJoin Our Telegram Group
")


