Silver prices decline to their lowest level in more than a week on Wednesday but find some backing at lower levels.
…
This is a premium post.
[s2If !current_user_can(access_s2member_level4)]Please register for FREE REGISTER to read full post below containing analysis. In case of any error or you think you are not able to read the full post below, please email us at support#nehcap.com [lwa][/s2If] [s2If current_user_can(access_s2member_level1)]
- Silver slides to over a one-week low on Wednesday, albeit finds some support at lower levels.
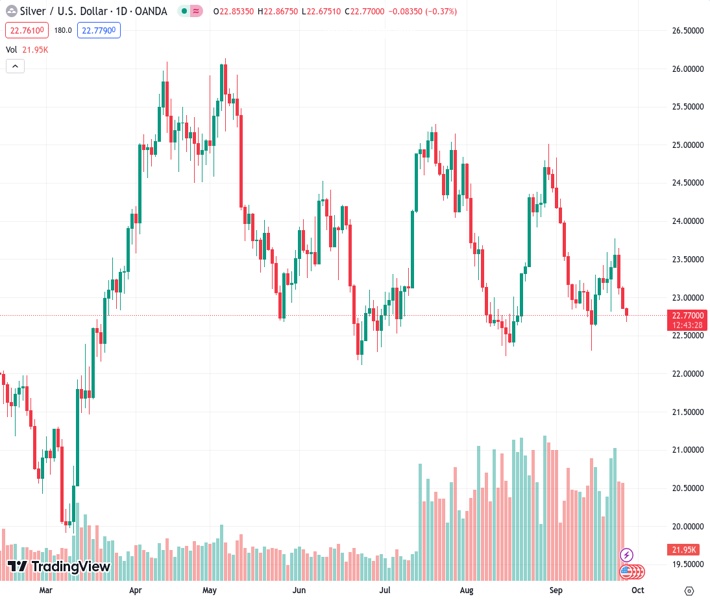
The pair currently trades last at 22.780.
The previous day high was 23.14 while the previous day low was 22.85. The daily 38.2% Fib levels comes at 22.96, expected to provide resistance. Similarly, the daily 61.8% fib level is at 23.03, expected to provide resistance.
Silver drifts lower for the third successive day on Wednesday and drops to a one-and-half-week low, around the $22.65 region during the early European session. The white metal, however, manages to recover a bit in the last hour and is currently trading around the $22.80-$22.75 area, still down around 0.30% for the day.
From a technical perspective, the overnight sustained break and close below the $23.00 round figure was seen as a fresh trigger for bearish traders. Furthermore, oscillators on the daily chart have again started gaining negative traction and support prospects for a further depreciating move for the XAG/USD. Hence, a subsequent slide back towards challenging an ascending trend line extending from the June monthly low, currently pegged around the $22.35 zone, looks like a distinct possibility.
A convincing break though the latter will confirm a fresh breakdown and expose the next relevant support is pegged near the $22.00 mark. Some follow-through selling will set the stage for additional losses. The XAG/USD might then accelerate the downward trajectory towards the $21.25 intermediate support before eventually dropping to the $21.00 round figure.
On the flip side, the $23.00 mark might now act as an immediate hurdle ahead of the $23.20-$23.25 zone and the very important 200-day Simple Moving Average (SMA), currently around the $23.45 region. This is followed by last week’s swing high, around the $23.75 area. A sustained strength beyond the latter has the potential to lift the XAG/USD towards the $24.00 round figure en route to the $24.30-$24.35 resistance, above which bulls could aim to reclaim the $25.00 psychological mark.
Technical Levels: Supports and Resistances
XAGUSD currently trading at 22.78 at the time of writing. Pair opened at 22.86 and is trading with a change of -0.35 % .
| Overview | Overview.1 | |
|---|---|---|
| 0 | Today last price | 22.78 |
| 1 | Today Daily Change | -0.08 |
| 2 | Today Daily Change % | -0.35 |
| 3 | Today daily open | 22.86 |
The pair remains strongly bearish on the daily time frame. It trades below the 20 SMA @ 23.36, 50 SMA 23.59, 100 SMA @ 23.57 and 200 SMA @ 23.47.
| Trends | Trends.1 | |
|---|---|---|
| 0 | Daily SMA20 | 23.36 |
| 1 | Daily SMA50 | 23.59 |
| 2 | Daily SMA100 | 23.57 |
| 3 | Daily SMA200 | 23.47 |
The previous day high was 23.14 while the previous day low was 22.85. The daily 38.2% Fib levels comes at 22.96, expected to provide resistance. Similarly, the daily 61.8% fib level is at 23.03, expected to provide resistance.
Note the levels of interest below:
- Pivot support is noted at 22.76, 22.66, 22.47
- Pivot resistance is noted at 23.05, 23.24, 23.34
| Levels | Levels.1 |
|---|---|
| Previous Daily High | 23.14 |
| Previous Daily Low | 22.85 |
| Previous Weekly High | 23.78 |
| Previous Weekly Low | 22.81 |
| Previous Monthly High | 25.02 |
| Previous Monthly Low | 22.23 |
| Daily Fibonacci 38.2% | 22.96 |
| Daily Fibonacci 61.8% | 23.03 |
| Daily Pivot Point S1 | 22.76 |
| Daily Pivot Point S2 | 22.66 |
| Daily Pivot Point S3 | 22.47 |
| Daily Pivot Point R1 | 23.05 |
| Daily Pivot Point R2 | 23.24 |
| Daily Pivot Point R3 | 23.34 |
[/s2If]
Download Nehcap EAWe have two EAs that are operational on our LIVE accounts.
- EA-FIX: Check out the details here. Download EA-FIX . EA-FIX is a non-grid HFT scalper.
- EA-GROWTH: High quality low dd EA using trend grids. Download EA_GROWTHJoin Our Telegram Group
")


