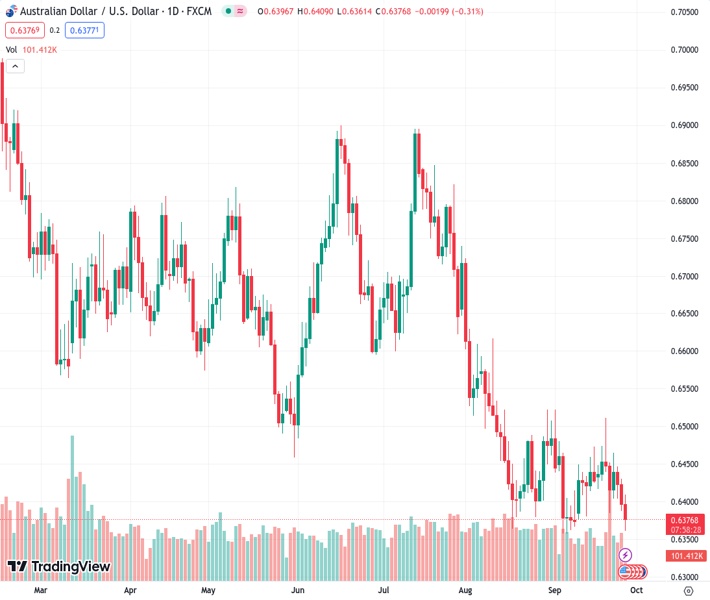
Despite a resurgence in Australia’s inflation, the AUDUSD currency pair at a rate of 0.63768 is still experiencing downward pressure from selling.
…
This is a premium post.
[s2If !current_user_can(access_s2member_level4)]Please register for FREE REGISTER to read full post below containing analysis. In case of any error or you think you are not able to read the full post below, please email us at support#nehcap.com [lwa][/s2If] [s2If current_user_can(access_s2member_level1)]
- AUD/USD continues to face selling pressure despite a rebound in Australia’s inflation.
The pair currently trades last at 0.63768.
The previous day high was 0.6431 while the previous day low was 0.6388. The daily 38.2% Fib levels comes at 0.6404, expected to provide resistance. Similarly, the daily 61.8% fib level is at 0.6414, expected to provide resistance.
The AUD/USD pair faced an intense sell-off while attempting to recapture the crucial resistance of 0.6400 on Wednesday. The Aussie asset drops despite a rebound in the Australian Consumer Price Index (CPI) data for August.
Australia’s monthly CPI rebounded to 5.2% from July’s reading of 4.9% as expected by the market participants. Major contributors to a rebound in Australian inflation were rising energy prices and house rentals. An expected rise in inflation has spurred expectations of one more interest rate hike from the Reserve Bank of Australia (RBA).
Meanwhile, the US Dollar Index (DXY) continues to capitalize on fears of a global slowdown due to higher interest rates by central bankers and a hot inflation environment. Apart from that, Federal Reserve (Fed) policymakers see the central bank is not done with interest rates yet as the US economy is resilient due to falling inflation and robust consumer spending.
AUD/USD trades near the lower portion of the Darvas Box pattern formed on a four-hour scale, which signifies that chances for a breakdown are high. The 200-period Exponential Moving Average (EMA) at 0.6457 continues to act as a major barricade for the Australian Dollar bulls.
The Relative Strength Index (RSI) (14) slips into the bearish range of 20.00-40.00, which indicates that the bearish impulse has been triggered.
A fresh downside would appear if the Aussie asset drops below August 17 low around 0.6360. This would expose the asset to the round-level support of 0.6300 followed by 03 November 2022 low at 0.6272.
In an alternate scenario, a decisive break above August 15 high around 0.6522 will drive the asset to August 9 high at 0.6571. Breach of the latter will drive the asset towards August 10 high at 0.6616.
Technical Levels: Supports and Resistances
AUDUSD currently trading at 0.6371 at the time of writing. Pair opened at 0.6397 and is trading with a change of -0.41 % .
| Overview | Overview.1 | |
|---|---|---|
| 0 | Today last price | 0.6371 |
| 1 | Today Daily Change | -0.0026 |
| 2 | Today Daily Change % | -0.4100 |
| 3 | Today daily open | 0.6397 |
The pair remains strongly bearish on the daily time frame. It trades below the 20 SMA @ 0.6428, 50 SMA 0.6507, 100 SMA @ 0.6598 and 200 SMA @ 0.6694.
| Trends | Trends.1 | |
|---|---|---|
| 0 | Daily SMA20 | 0.6428 |
| 1 | Daily SMA50 | 0.6507 |
| 2 | Daily SMA100 | 0.6598 |
| 3 | Daily SMA200 | 0.6694 |
The previous day high was 0.6431 while the previous day low was 0.6388. The daily 38.2% Fib levels comes at 0.6404, expected to provide resistance. Similarly, the daily 61.8% fib level is at 0.6414, expected to provide resistance.
Note the levels of interest below:
- Pivot support is noted at 0.638, 0.6362, 0.6336
- Pivot resistance is noted at 0.6423, 0.6448, 0.6466
| Levels | Levels.1 |
|---|---|
| Previous Daily High | 0.6431 |
| Previous Daily Low | 0.6388 |
| Previous Weekly High | 0.6511 |
| Previous Weekly Low | 0.6385 |
| Previous Monthly High | 0.6724 |
| Previous Monthly Low | 0.6364 |
| Daily Fibonacci 38.2% | 0.6404 |
| Daily Fibonacci 61.8% | 0.6414 |
| Daily Pivot Point S1 | 0.6380 |
| Daily Pivot Point S2 | 0.6362 |
| Daily Pivot Point S3 | 0.6336 |
| Daily Pivot Point R1 | 0.6423 |
| Daily Pivot Point R2 | 0.6448 |
| Daily Pivot Point R3 | 0.6466 |
[/s2If]
Download Nehcap EAWe have two EAs that are operational on our LIVE accounts.
- EA-FIX: Check out the details here. Download EA-FIX . EA-FIX is a non-grid HFT scalper.
- EA-GROWTH: High quality low dd EA using trend grids. Download EA_GROWTHJoin Our Telegram Group
")


