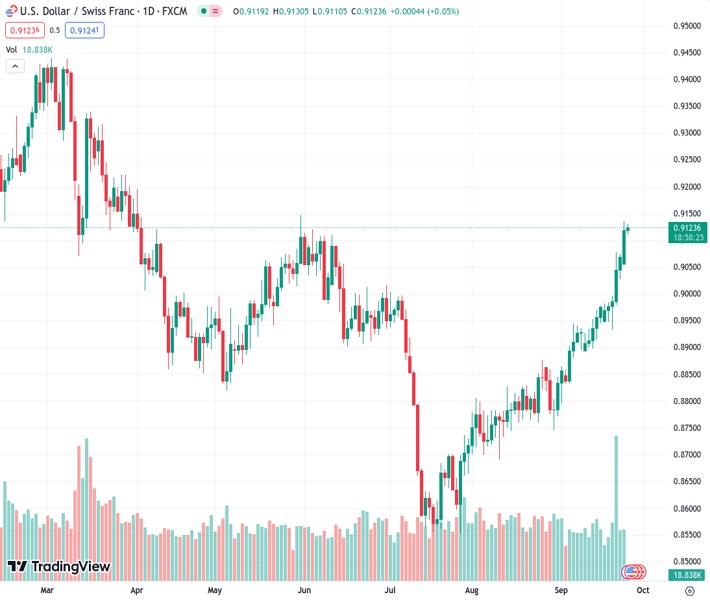
The USDCHF pair is currently at 0.91241 and is maintaining a strong position close to its highest level in several months. It continues to receive solid backing from a variety of factors.
…
This is a premium post.
[s2If !current_user_can(access_s2member_level4)]Please register for FREE REGISTER to read full post below containing analysis. In case of any error or you think you are not able to read the full post below, please email us at support#nehcap.com [lwa][/s2If] [s2If current_user_can(access_s2member_level1)]
- USD/CHF stands tall near a multi-month top and remains well supported by a combination of factors.
The pair currently trades last at 0.91241.
The previous day high was 0.9136 while the previous day low was 0.9061. The daily 38.2% Fib levels comes at 0.9107, expected to provide support. Similarly, the daily 61.8% fib level is at 0.9089, expected to provide support.
The USD/CHF pair consolidates its recent strong gains to the highest level since late May touched the previous day and oscillates in a narrow band during the Asian session on Tuesday. Spot prices currently trade around the 0.9125 region and seem poised to prolong a two-month-old upward trajectory.
The Swiss National Bank (SNB) surprised markets last Thursday and decided to pause its rate-hiking cycle for the first time since March 2022, noting that inflation has subsided. This, in turn, continues to undermine the Swiss Franc (CHF), which, along with the underlying bullish sentiment surrounding the US Dollar (USD), is seen acting as a tailwind for the USD/CHF pair. In fact, the USD Index (DXY), which tracks the Greenback against a basket of currencies, stood by the 10-month peak touched on Monday and remains well supported by the Federal Reserve’s (Fed) hawkish outlook.
The US central bank reiterated its higher-for-longer interest rates narrative and warned that still-sticky inflation was likely to attract at least one more hike by the end of this year. Furthermore, investors are now getting increasingly wary about the potential inflationary impact of rising Oil prices. This, along with the incoming resilient US macro data, should allow the Fed to stick to its hawkish stance. The outlook, meanwhile, leads to an extended selloff in the US fixed incoming market, pushing the yield on the rate-sensitive two-year government bond to its highest level since 2006.
The benchmark 10-year US Treasury yield also climbs to a 16-year peak, further beyond the 4.50% threshold, and continues to underpin the Greenback. That said, the extremely overbought Relative Strength Index (RSI) on the daily chart is holding back traders from placing fresh bullish bets around the USD/CHF pair. The recent breakout through a technically significant 200-day Simple Moving Average (SMA), meanwhile, suggests that the path of least resistance for spot prices is to the upside and any meaningful corrective pullback is more likely to get bought into.
Market participants now look to the US economic docket – featuring the release of the Conference Board’s Consumer Confidence Index, New Home Sales and the Richmond Manufacturing Index. This, along with the US bond yields, will influence the USD price dynamics and produce short-trading opportunities around the USD/CHF pair. Bulls, however, might wait for some near-term consolidation before positioning for any further appreciating move.
Technical Levels: Supports and Resistances
USDCHF currently trading at 0.9125 at the time of writing. Pair opened at 0.912 and is trading with a change of 0.05 % .
| Overview | Overview.1 | |
|---|---|---|
| 0 | Today last price | 0.9125 |
| 1 | Today Daily Change | 0.0005 |
| 2 | Today Daily Change % | 0.0500 |
| 3 | Today daily open | 0.9120 |
The pair remains strongly bullish on the daily timeframe. It trades above its 20 SMA @ 0.8931, 50 SMA 0.8816, 100 SMA @ 0.8888 and 200 SMA @ 0.9034.
| Trends | Trends.1 | |
|---|---|---|
| 0 | Daily SMA20 | 0.8931 |
| 1 | Daily SMA50 | 0.8816 |
| 2 | Daily SMA100 | 0.8888 |
| 3 | Daily SMA200 | 0.9034 |
The previous day high was 0.9136 while the previous day low was 0.9061. The daily 38.2% Fib levels comes at 0.9107, expected to provide support. Similarly, the daily 61.8% fib level is at 0.9089, expected to provide support.
Note the levels of interest below:
- Pivot support is noted at 0.9075, 0.903, 0.9
- Pivot resistance is noted at 0.915, 0.918, 0.9225
| Levels | Levels.1 |
|---|---|
| Previous Daily High | 0.9136 |
| Previous Daily Low | 0.9061 |
| Previous Weekly High | 0.9078 |
| Previous Weekly Low | 0.8932 |
| Previous Monthly High | 0.8876 |
| Previous Monthly Low | 0.8690 |
| Daily Fibonacci 38.2% | 0.9107 |
| Daily Fibonacci 61.8% | 0.9089 |
| Daily Pivot Point S1 | 0.9075 |
| Daily Pivot Point S2 | 0.9030 |
| Daily Pivot Point S3 | 0.9000 |
| Daily Pivot Point R1 | 0.9150 |
| Daily Pivot Point R2 | 0.9180 |
| Daily Pivot Point R3 | 0.9225 |
[/s2If]
Download Nehcap EAWe have two EAs that are operational on our LIVE accounts.
- EA-FIX: Check out the details here. Download EA-FIX . EA-FIX is a non-grid HFT scalper.
- EA-GROWTH: High quality low dd EA using trend grids. Download EA_GROWTHJoin Our Telegram Group
")


