The USDCAD currency pair has seen slight increases due to a rise in demand for the USD and a drop in oil prices.
…
This is a premium post.
[s2If !current_user_can(access_s2member_level4)]Please register for FREE REGISTER to read full post below containing analysis. In case of any error or you think you are not able to read the full post below, please email us at support#nehcap.com [lwa][/s2If] [s2If current_user_can(access_s2member_level1)]
- USD/CAD posts modest gains amid the USD demand and a decline in oil prices.
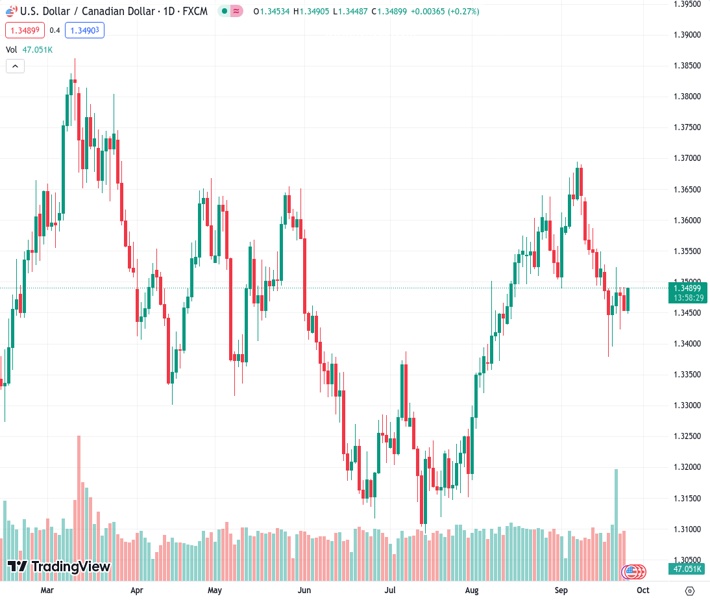
The pair currently trades last at 1.34885.
The previous day high was 1.3492 while the previous day low was 1.3453. The daily 38.2% Fib levels comes at 1.3468, expected to provide support. Similarly, the daily 61.8% fib level is at 1.3477, expected to provide support.
The USD/CAD pair recovers its recent losses during the early European trading hours on Tuesday. The pair currently trades near 1.3487, gaining 0.25% for the day.
The hawkish stance from the Federal Reserve (Fed) officials and a decline in oil prices are the main drivers for the pair. Market players await the Canadian GDP numbers and the US Core Personal Consumption Expenditure (PCE) Price Index data on Friday for fresh impetus.
From the technical perspective, USD/CAD holds below the 50- and 100-hour Exponential Moving Averages (EMAs) with a downward slope on the four-hour chart, which supports the sellers for the time being. Meanwhile, the Relative Strength Index (RSI) is located in the 40-60 zone, indicating a non-directional movement in the USD/CAD pair.
The critical resistance level for the pair is seen near the confluence of the upper boundary of the Bollinger Band and 100-hour EMA at the 1.3505-1.3515 zone. The additional upside filter to watch is near a high of September 15 at 1.3550. Any follow-through buying above the latter will pave the way to a high of September 13 at 1.3586, followed by a psychological round figure at 1.3600.
On the downside, a break below the lower limit of the Bollinger Band of 1.3443 will see a drop to a key contention at 1.3400. The mentioned level represents a psychological figure and a low of August 11. Further south, the next downside stop will emerge at 1.3380 (a low of September 19).
Technical Levels: Supports and Resistances
USDCAD currently trading at 1.3487 at the time of writing. Pair opened at 1.3454 and is trading with a change of 0.25 % .
| Overview | Overview.1 | |
|---|---|---|
| 0 | Today last price | 1.3487 |
| 1 | Today Daily Change | 0.0033 |
| 2 | Today Daily Change % | 0.2500 |
| 3 | Today daily open | 1.3454 |
The pair is trading below its 20 Daily moving average @ 1.3545, above its 50 Daily moving average @ 1.3446 , above its 100 Daily moving average @ 1.34 and above its 200 Daily moving average @ 1.3461
| Trends | Trends.1 | |
|---|---|---|
| 0 | Daily SMA20 | 1.3545 |
| 1 | Daily SMA50 | 1.3446 |
| 2 | Daily SMA100 | 1.3400 |
| 3 | Daily SMA200 | 1.3461 |
The previous day high was 1.3492 while the previous day low was 1.3453. The daily 38.2% Fib levels comes at 1.3468, expected to provide support. Similarly, the daily 61.8% fib level is at 1.3477, expected to provide support.
Note the levels of interest below:
- Pivot support is noted at 1.3441, 1.3428, 1.3402
- Pivot resistance is noted at 1.3479, 1.3505, 1.3518
| Levels | Levels.1 |
|---|---|
| Previous Daily High | 1.3492 |
| Previous Daily Low | 1.3453 |
| Previous Weekly High | 1.3528 |
| Previous Weekly Low | 1.3379 |
| Previous Monthly High | 1.3640 |
| Previous Monthly Low | 1.3184 |
| Daily Fibonacci 38.2% | 1.3468 |
| Daily Fibonacci 61.8% | 1.3477 |
| Daily Pivot Point S1 | 1.3441 |
| Daily Pivot Point S2 | 1.3428 |
| Daily Pivot Point S3 | 1.3402 |
| Daily Pivot Point R1 | 1.3479 |
| Daily Pivot Point R2 | 1.3505 |
| Daily Pivot Point R3 | 1.3518 |
[/s2If]
Download Nehcap EAWe have two EAs that are operational on our LIVE accounts.
- EA-FIX: Check out the details here. Download EA-FIX . EA-FIX is a non-grid HFT scalper.
- EA-GROWTH: High quality low dd EA using trend grids. Download EA_GROWTHJoin Our Telegram Group
")


