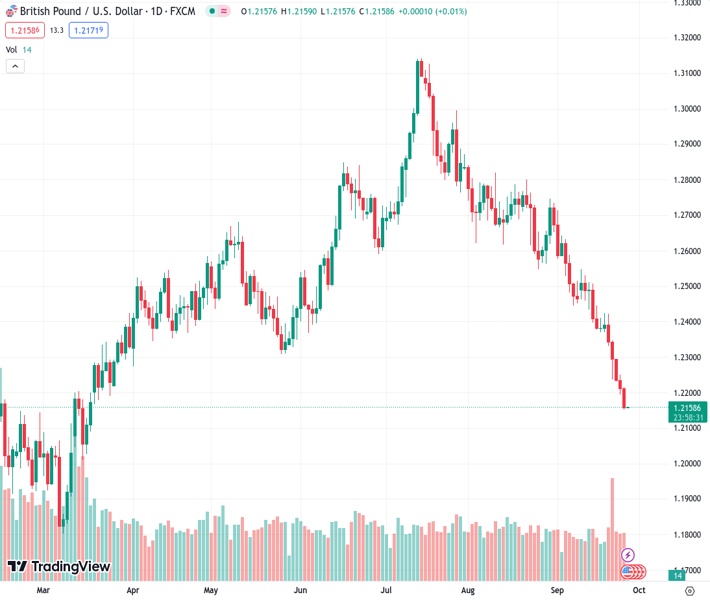
The GBPUSD currency pair, trading at a rate of 1.21570, has experienced a decrease of 0.46% due to investor aversion to risk following the Bank of England’s decision last week.
…
This is a premium post.
[s2If !current_user_can(access_s2member_level4)]Please register for FREE REGISTER to read full post below containing analysis. In case of any error or you think you are not able to read the full post below, please email us at support#nehcap.com [lwa][/s2If] [s2If current_user_can(access_s2member_level1)]
- GBP/USD prints losses of 0.46%, on risk-off, after last week’s BoE’s decision.
The pair currently trades last at 1.21570.
The previous day high was 1.2256 while the previous day low was 1.2194. The daily 38.2% Fib levels comes at 1.2218, expected to provide resistance. Similarly, the daily 61.8% fib level is at 1.2232, expected to provide resistance.
The British Pound (GBP) still trades on the back foot against the US Dollar (USD) slumps below the 1.2200 psychological level, with sellers setting their sights on the 1.2000 figure. The GBP/USD is trading at 1.2159 after hitting a daily high of 1.2215.
Wall Street finished the session with losses as risk aversion continues to dominate the financial markets narrative. Traders bracing for the “higher-for-longer” Federal Reserve’s mantra has kept the Greenback rallying due to high US bond yields.
On Tuesday, Minnesota Fed President Neil Kashkari said that another rate hike is needed, and then it would be necessary to hold rates at that level while adding that a soft landing is possible.
Recently, other Fed speakers commented that the US central bank needs patience, while others like Fed Governor Bowman stressed that another interest rate hike is needed. Hence, based on the latest “dot plots” reported in September’s Summary of Economic Projections (SEP), the Fed would hike 25 bps toward the end of the year and would keep rates above the 5% threshold through all the next year.
On the UK front, the lack of data leaves traders leaning on the latest Bank of England’s (BoE) decision, perceived as a dovish one, following an inflation report showing that inflation is cooling down. Nevertheless, the latest UK economic data, particularly softer retail sales, PMIs, and GDP clinging to positive territory, has reignited recessionary fears.
The GBP/USD is downward biased, and after dropping below the May 25 low of 1.2308 – also the last cycle low, it opened the door for further losses. Before cracking that level, the pair showed signs of selling strength once it broke below the 200-day moving average (DMA) at 1.2432. As of writing, the major hovers in the mid 1.2100/1.2200 figure, though a breach below 1.2100 could open the door to test the March 15 daily low of 1.2010. before testing the 1.2000 figure.
Technical Levels: Supports and Resistances
GBPUSD currently trading at 1.2156 at the time of writing. Pair opened at 1.2212 and is trading with a change of -0.46 % .
| Overview | Overview.1 | |
|---|---|---|
| 0 | Today last price | 1.2156 |
| 1 | Today Daily Change | -0.0056 |
| 2 | Today Daily Change % | -0.4600 |
| 3 | Today daily open | 1.2212 |
The pair remains strongly bearish on the daily time frame. It trades below the 20 SMA @ 1.2471, 50 SMA 1.2649, 100 SMA @ 1.2639 and 200 SMA @ 1.2434.
| Trends | Trends.1 | |
|---|---|---|
| 0 | Daily SMA20 | 1.2471 |
| 1 | Daily SMA50 | 1.2649 |
| 2 | Daily SMA100 | 1.2639 |
| 3 | Daily SMA200 | 1.2434 |
The previous day high was 1.2256 while the previous day low was 1.2194. The daily 38.2% Fib levels comes at 1.2218, expected to provide resistance. Similarly, the daily 61.8% fib level is at 1.2232, expected to provide resistance.
Note the levels of interest below:
- Pivot support is noted at 1.2185, 1.2159, 1.2123
- Pivot resistance is noted at 1.2247, 1.2282, 1.2309
| Levels | Levels.1 |
|---|---|
| Previous Daily High | 1.2256 |
| Previous Daily Low | 1.2194 |
| Previous Weekly High | 1.2425 |
| Previous Weekly Low | 1.2231 |
| Previous Monthly High | 1.2841 |
| Previous Monthly Low | 1.2548 |
| Daily Fibonacci 38.2% | 1.2218 |
| Daily Fibonacci 61.8% | 1.2232 |
| Daily Pivot Point S1 | 1.2185 |
| Daily Pivot Point S2 | 1.2159 |
| Daily Pivot Point S3 | 1.2123 |
| Daily Pivot Point R1 | 1.2247 |
| Daily Pivot Point R2 | 1.2282 |
| Daily Pivot Point R3 | 1.2309 |
[/s2If]
Download Nehcap EAWe have two EAs that are operational on our LIVE accounts.
- EA-FIX: Check out the details here. Download EA-FIX . EA-FIX is a non-grid HFT scalper.
- EA-GROWTH: High quality low dd EA using trend grids. Download EA_GROWTHJoin Our Telegram Group
")


