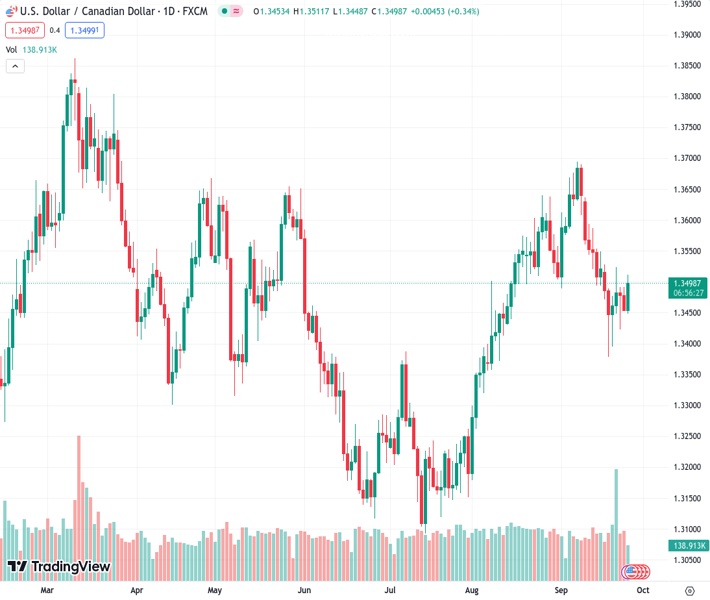
The currency pair USDCAD reached a new high of slightly above 1.3500, marking the highest level in the past two days, as the US Dollar continues its upward trend.
…
This is a premium post.
[s2If !current_user_can(access_s2member_level4)]Please register for FREE REGISTER to read full post below containing analysis. In case of any error or you think you are not able to read the full post below, please email us at support#nehcap.com [lwa][/s2If] [s2If current_user_can(access_s2member_level1)]
- USD/CAD prints a fresh two-day high nominally above 1.3500 as the US Dollar resumes its upside journey.
The pair currently trades last at 1.34988.
The previous day high was 1.3492 while the previous day low was 1.3453. The daily 38.2% Fib levels comes at 1.3468, expected to provide support. Similarly, the daily 61.8% fib level is at 1.3477, expected to provide support.
The USD/CAD pair consolidates near the psychological resistance of 1.3500 in the early New York session. The Loonie asset strengthens as an extended correction in the oil price builds pressure on the Canadian Dollar.
The S&P500 opened on a negative note as Federal Reserve (Fed) policymakers delivered hawkish interest rate guidance. The US Dollar Index (DXY) delivers a nominal correction after printing a fresh 10-month high near 106.20.
Fed policymakers: Minneapolis Federal Reserve Bank President Neel Kashkari and Boston Fed President Susan Collins, supported for further policy-tightening as robust consumer spending could rebound inflationary pressures. Meanwhile, investors await the US Consumer Confidence and New Home Sales data.
USD/CAD trades near the downward-sloping trendline of the Symmetrical Triangle chart pattern, which is plotted from September 15 high around 1.3550. The upward-sloping trendline of the aforementioned chart pattern is placed from September 19 low at 1.3380. Advancing 20-period Exponential Moving Average (EMA) at 1.3485 indicates that the short-term trend is bullish.
The Relative Strength Index (RSI) (14) aims to shift into the bullish range of 60.00-80.00. A sustained RSI (14) movement in the bullish range would trigger a bullish impulse.
A decisive break above September 21 high at 1.3524 would drive the asset towards September 11 low around 1.3560, followed by the round-level resistance at 1.3600.
In an alternate scenario, a breakdown below September 25 low around 1.3450 would drag the asset toward September 20 low near 1.3400. A further breakdown could expose the asset to a six-week low near 1.3356.
Technical Levels: Supports and Resistances
USDCAD currently trading at 1.3504 at the time of writing. Pair opened at 1.3454 and is trading with a change of 0.37 % .
| Overview | Overview.1 | |
|---|---|---|
| 0 | Today last price | 1.3504 |
| 1 | Today Daily Change | 0.0050 |
| 2 | Today Daily Change % | 0.3700 |
| 3 | Today daily open | 1.3454 |
The pair is trading below its 20 Daily moving average @ 1.3545, above its 50 Daily moving average @ 1.3446 , above its 100 Daily moving average @ 1.34 and above its 200 Daily moving average @ 1.3461
| Trends | Trends.1 | |
|---|---|---|
| 0 | Daily SMA20 | 1.3545 |
| 1 | Daily SMA50 | 1.3446 |
| 2 | Daily SMA100 | 1.3400 |
| 3 | Daily SMA200 | 1.3461 |
The previous day high was 1.3492 while the previous day low was 1.3453. The daily 38.2% Fib levels comes at 1.3468, expected to provide support. Similarly, the daily 61.8% fib level is at 1.3477, expected to provide support.
Note the levels of interest below:
- Pivot support is noted at 1.3441, 1.3428, 1.3402
- Pivot resistance is noted at 1.3479, 1.3505, 1.3518
| Levels | Levels.1 |
|---|---|
| Previous Daily High | 1.3492 |
| Previous Daily Low | 1.3453 |
| Previous Weekly High | 1.3528 |
| Previous Weekly Low | 1.3379 |
| Previous Monthly High | 1.3640 |
| Previous Monthly Low | 1.3184 |
| Daily Fibonacci 38.2% | 1.3468 |
| Daily Fibonacci 61.8% | 1.3477 |
| Daily Pivot Point S1 | 1.3441 |
| Daily Pivot Point S2 | 1.3428 |
| Daily Pivot Point S3 | 1.3402 |
| Daily Pivot Point R1 | 1.3479 |
| Daily Pivot Point R2 | 1.3505 |
| Daily Pivot Point R3 | 1.3518 |
[/s2If]
Download Nehcap EAWe have two EAs that are operational on our LIVE accounts.
- EA-FIX: Check out the details here. Download EA-FIX . EA-FIX is a non-grid HFT scalper.
- EA-GROWTH: High quality low dd EA using trend grids. Download EA_GROWTHJoin Our Telegram Group
")


