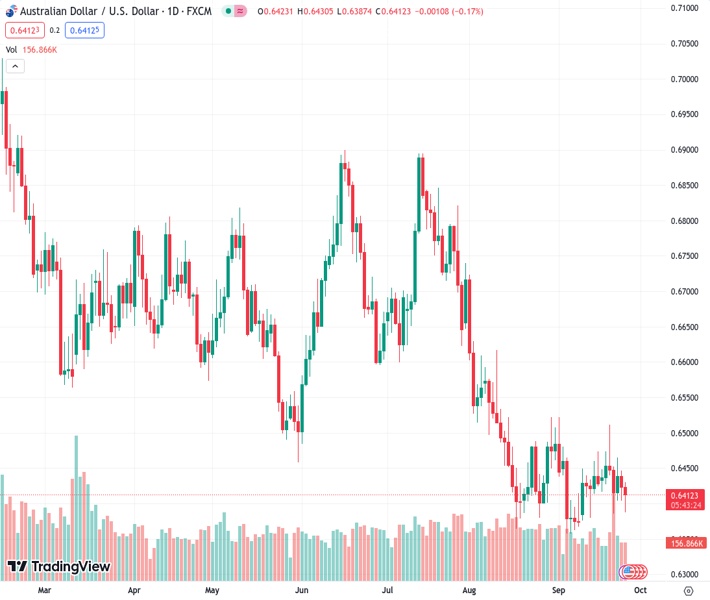
The Australian Dollar to US Dollar exchange rate, currently at 0.64120, has dropped by 0.08% to 0.6418. Sellers have set their sights on reaching the 0.6400 level, and there is a possibility of breaking below an important support trendline that has been in place for two and a half years.
…
This is a premium post.
[s2If !current_user_can(access_s2member_level4)]Please register for FREE REGISTER to read full post below containing analysis. In case of any error or you think you are not able to read the full post below, please email us at support#nehcap.com [lwa][/s2If] [s2If current_user_can(access_s2member_level1)]
- AUD/USD trades at 0.6418, down 0.08%, with sellers targeting the 0.6400 figure and a potential break below a crucial two-and-a-half-year support trendline.
The pair currently trades last at 0.64120.
The previous day high was 0.6447 while the previous day low was 0.6404. The daily 38.2% Fib levels comes at 0.642, expected to provide resistance. Similarly, the daily 61.8% fib level is at 0.6431, expected to provide resistance.
The Australian Dollar (AUD) prolonged its losses against the US Dollar (USD) early in the North American session after hitting a daily high of 0.6430. Sellers are eyeing the 0.6400 figure and a break below a two-and-a-half-year support trendline that could cement a weaker outlook for the major. The AUD/USD is trading at 0.6418, down 0.08%.
The AUD/USD remains pressured due to risk aversion, higher US Treasury bond yields, and the interest rate difference between Australia and the United States (US). Although US Treasury bond yields retraced somewhat from multi-year highs, the Greenback (USD) remains in the front foot after touching a new year-to-date (YTD) high of 106.20, as revealed by the US Dollar Index (DXY).
On the data front, Building Permits in the US grew more than July’s 1.443M, and came at 1.541M in August, while home prices continued to rise due to higher mortgage rates in the US. Nevertheless, New Home Sales plunged -8.7%, compared to July’s 8% increase, signaling the housing market is weakening amidst 525 basis points of tightening by the US Federal Reserve.
Further data showed that Consumer Confidence revealed by the Conference Board (CB) slid to a four-month low, blamed on a deterioration in the economic outlook for the economy. The CB Consumer Sentiment index rose by 103 from August 108.7, as data shows. Dana Peterson, the chief economist, commented that consumers are worried about rising prices in general, particularly food and gasoline, and expressed concerns about higher interest rates and the political situation.
Australia would feature its Monthly Consumer Price Index (CPI) for August, with inflation foreseen to jump from 4.9% to 5.2%. The US economic agenda would feature Fed speakers led by Bowman, Durable Goods Orders, GDP, Initial Jobless Claims, and the Fed’s preferred gauge for inflation, Core PCE.
The daily chart is neutral to downward biased, as the pair consolidated at around the year’s lows and is testing a multi-year support trendline. A breach of the latter could pave the way to test the year-to-date (YTD) low of 0.6357, followed by a drop to the November 22 swing low of 0.6272. Conversely, buyers must reclaim 0.6500 and the 50-day moving average (DMA) at 0.6506 to remain hopeful for higher prices.
Technical Levels: Supports and Resistances
AUDUSD currently trading at 0.6417 at the time of writing. Pair opened at 0.6424 and is trading with a change of -0.11 % .
| Overview | Overview.1 | |
|---|---|---|
| 0 | Today last price | 0.6417 |
| 1 | Today Daily Change | -0.0007 |
| 2 | Today Daily Change % | -0.1100 |
| 3 | Today daily open | 0.6424 |
The pair remains strongly bearish on the daily time frame. It trades below the 20 SMA @ 0.6432, 50 SMA 0.6515, 100 SMA @ 0.6601 and 200 SMA @ 0.6695.
| Trends | Trends.1 | |
|---|---|---|
| 0 | Daily SMA20 | 0.6432 |
| 1 | Daily SMA50 | 0.6515 |
| 2 | Daily SMA100 | 0.6601 |
| 3 | Daily SMA200 | 0.6695 |
The previous day high was 0.6447 while the previous day low was 0.6404. The daily 38.2% Fib levels comes at 0.642, expected to provide resistance. Similarly, the daily 61.8% fib level is at 0.6431, expected to provide resistance.
Note the levels of interest below:
- Pivot support is noted at 0.6403, 0.6382, 0.6361
- Pivot resistance is noted at 0.6445, 0.6467, 0.6488
| Levels | Levels.1 |
|---|---|
| Previous Daily High | 0.6447 |
| Previous Daily Low | 0.6404 |
| Previous Weekly High | 0.6511 |
| Previous Weekly Low | 0.6385 |
| Previous Monthly High | 0.6724 |
| Previous Monthly Low | 0.6364 |
| Daily Fibonacci 38.2% | 0.6420 |
| Daily Fibonacci 61.8% | 0.6431 |
| Daily Pivot Point S1 | 0.6403 |
| Daily Pivot Point S2 | 0.6382 |
| Daily Pivot Point S3 | 0.6361 |
| Daily Pivot Point R1 | 0.6445 |
| Daily Pivot Point R2 | 0.6467 |
| Daily Pivot Point R3 | 0.6488 |
[/s2If]
Download Nehcap EAWe have two EAs that are operational on our LIVE accounts.
- EA-FIX: Check out the details here. Download EA-FIX . EA-FIX is a non-grid HFT scalper.
- EA-GROWTH: High quality low dd EA using trend grids. Download EA_GROWTHJoin Our Telegram Group
")


