The AUDUSD currency pair has bounced back from a level below 0.6400, as the USD Index was unable to continue its upward movement.
…
This is a premium post.
[s2If !current_user_can(access_s2member_level4)]Please register for FREE REGISTER to read full post below containing analysis. In case of any error or you think you are not able to read the full post below, please email us at support#nehcap.com [lwa][/s2If] [s2If current_user_can(access_s2member_level1)]
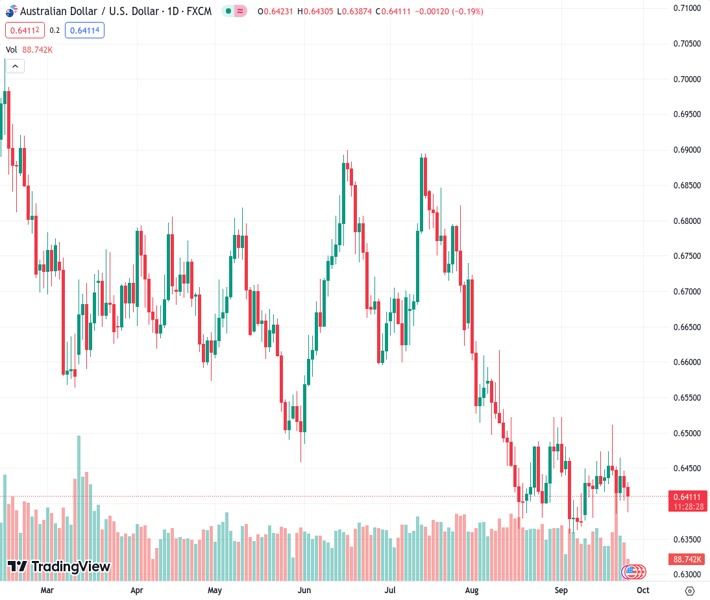
- AUD/USD rebounds from below 0.6400 as the USD Index fails to extend the rally.
The pair currently trades last at 0.64100.
The previous day high was 0.6447 while the previous day low was 0.6404. The daily 38.2% Fib levels comes at 0.642, expected to provide resistance. Similarly, the daily 61.8% fib level is at 0.6431, expected to provide resistance.
The AUD/USD pair attempts recovery after discovering buying interest near the round-level support of 0.6400 in the European session. The Aussie asset finds support as the US Dollar Index (DXY) struggles to extend a rally above a fresh 10-month high near 106.20.
S&P500 futures generated significant losses in the London session, portraying strength in the risk-aversion theme. The US Dollar is expected to remain on tenterhooks as investors await the United States Durable Goods Orders data for August, which will be released on Wednesday. The economic data is seen contracting at a slower pace of 0.4% vs. July’s contraction of 5.2%.
Meanwhile, the Australian Dollar is expected to remain on the tenterhooks ahead of the monthly Consumer Price Index (CPI) data for August. The Australian inflation is seen accelerating to 5.2% vs. July’s reading of 4.9%. A rebound in Australian inflation could be the outcome of the rising energy prices due to the global oil rally.
AUD/USD rebounds after testing September 21 low near 0.6385 on an hourly scale. The downward-sloping trendline from September 20 high at 0.6511 continues to act as a major barricade for the Australian Dollar bulls. The Aussie asset is forming a Descending Triangle chart pattern, which demonstrates a volatility contraction.
The 20-period Exponential Moving Average (EMA) at 0.6416 is acting as a major barricade for the Aussie bulls.
Meanwhile, the Relative Strength Index (RSI) (14) manages to defend slipping completely into the bearish range of 20.00-40.00.
A decisive break above August 15 high around 0.6522 will drive the asset to August 9 high at 0.6571. Breach of the latter will drive the asset towards August 10 high at 0.6616.
On the flip side, a fresh downside would appear if the Aussie asset drops below August 17 low around 0.6360. This would expose the asset to the round-level support of 0.6300 followed by 03 November 2022 low at 0.6272.
Technical Levels: Supports and Resistances
AUDUSD currently trading at 0.6407 at the time of writing. Pair opened at 0.6424 and is trading with a change of -0.26 % .
| Overview | Overview.1 | |
|---|---|---|
| 0 | Today last price | 0.6407 |
| 1 | Today Daily Change | -0.0017 |
| 2 | Today Daily Change % | -0.2600 |
| 3 | Today daily open | 0.6424 |
The pair remains strongly bearish on the daily time frame. It trades below the 20 SMA @ 0.6432, 50 SMA 0.6515, 100 SMA @ 0.6601 and 200 SMA @ 0.6695.
| Trends | Trends.1 | |
|---|---|---|
| 0 | Daily SMA20 | 0.6432 |
| 1 | Daily SMA50 | 0.6515 |
| 2 | Daily SMA100 | 0.6601 |
| 3 | Daily SMA200 | 0.6695 |
The previous day high was 0.6447 while the previous day low was 0.6404. The daily 38.2% Fib levels comes at 0.642, expected to provide resistance. Similarly, the daily 61.8% fib level is at 0.6431, expected to provide resistance.
Note the levels of interest below:
- Pivot support is noted at 0.6403, 0.6382, 0.6361
- Pivot resistance is noted at 0.6445, 0.6467, 0.6488
| Levels | Levels.1 |
|---|---|
| Previous Daily High | 0.6447 |
| Previous Daily Low | 0.6404 |
| Previous Weekly High | 0.6511 |
| Previous Weekly Low | 0.6385 |
| Previous Monthly High | 0.6724 |
| Previous Monthly Low | 0.6364 |
| Daily Fibonacci 38.2% | 0.6420 |
| Daily Fibonacci 61.8% | 0.6431 |
| Daily Pivot Point S1 | 0.6403 |
| Daily Pivot Point S2 | 0.6382 |
| Daily Pivot Point S3 | 0.6361 |
| Daily Pivot Point R1 | 0.6445 |
| Daily Pivot Point R2 | 0.6467 |
| Daily Pivot Point R3 | 0.6488 |
[/s2If]
Download Nehcap EAWe have two EAs that are operational on our LIVE accounts.
- EA-FIX: Check out the details here. Download EA-FIX . EA-FIX is a non-grid HFT scalper.
- EA-GROWTH: High quality low dd EA using trend grids. Download EA_GROWTHJoin Our Telegram Group
")


