Some sellers are drawn to the AUDUSD currency pair at a rate of 0.63934 due to fears of risk and a stronger US dollar.
…
This is a premium post.
[s2If !current_user_can(access_s2member_level4)]Please register for FREE REGISTER to read full post below containing analysis. In case of any error or you think you are not able to read the full post below, please email us at support#nehcap.com [lwa][/s2If] [s2If current_user_can(access_s2member_level1)]
- AUD/USD attracts some sellers amid the risk aversion and stronger USD.
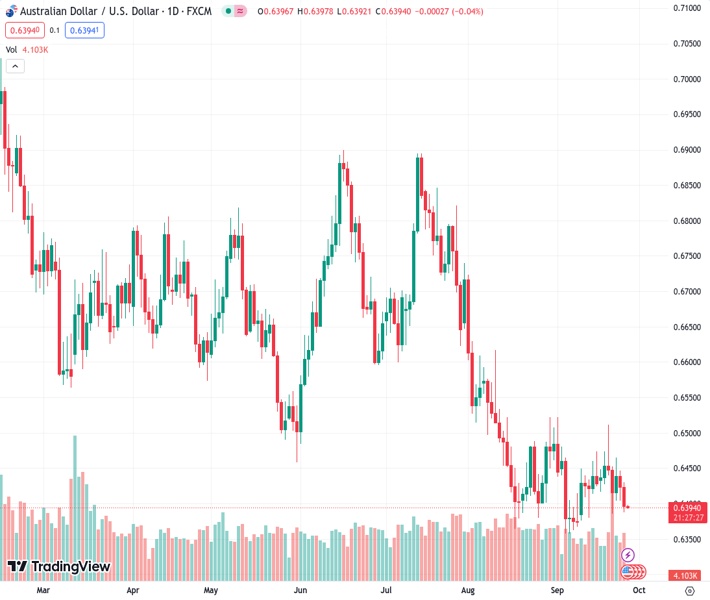
The pair currently trades last at 0.63934.
The previous day high was 0.6447 while the previous day low was 0.6404. The daily 38.2% Fib levels comes at 0.642, expected to provide resistance. Similarly, the daily 61.8% fib level is at 0.6431, expected to provide resistance.
The AUD/USD pair remains under selling pressure and drops below 0.6400 during the early Asian session on Wednesday. The pair is weighed by the negative sentiment and a decline in commodity prices. The pair currently trades around 0.6394, losing 0.03% on the day.
Meanwhile, the US Dollar Index (DXY), a measure of the value of the USD relative to a basket of foreign currencies, hovers around 106.17 after retreating from the highest level since November of 106.26.
On Tuesday, the US Consumer Confidence released by the Conference Board (CB) for September rose by 103.0 from 108.7 in August. The data indicated the impact of higher interest rates and concerns about the political environment. The Building Permits came in at 1.541M in August versus 1.443M prior. Additionally, the House Price Index for July climbed to 0.8% MoM from 0.4% in the previous reading, better than expected at 0.5%. New Home Sales dropped -8.7% in August from an 8% increase in July.
The Federal Reserve (Fed) decided to hold the interest rate unchanged in the 5.25% to 5.50% range last week. In terms of macroeconomic predictions, most members still expect further rate rises later this year. Minneapolis Federal Reserve Bank President, Neel Kashkari stated on Tuesday that he is one of the fed policymakers who sees one more rate hike this year. He added that US rates probably have to go a little bit higher and be held there for longer, to cool things off. The hawkish comments from Fed officials boost the US Dollar (USD) across the board and act as a headwind for the AUD/USD pair.
On the other hand, the Aussie attracts some sellers due to risk aversion. The release of Australian Consumer Price Index (CPI) data will be a closely watched event. The release of the Reserve Bank of Australia’s (RBA) Minutes on the September monetary policy meeting revealed that additional tightening may be necessary if inflation proves more persistent than anticipated. But the case for maintaining the status quo was stronger. This, in turn, might cap the upside of the Aussie and weigh on the AUD/USD pair.
Market participants will closely watch the Australian Consumer Price Index (CPI) data for August due later on Wednesday. The annual figure is expected to rise from 4.9% to 5.2%. Also, the US Durable Goods Orders report will be released on Wednesday. The attention will shift to the Core Personal Consumption Expenditure (PCE) Price Index, the Fed’s preferred measure of consumer inflation, due on Friday. The annual figure is expected to drop from 4.2% to 3.9%. Traders will take cues from the data and find trading opportunities around the AUD/USD pair.
Technical Levels: Supports and Resistances
AUDUSD currently trading at 0.6395 at the time of writing. Pair opened at 0.6424 and is trading with a change of -0.45 % .
| Overview | Overview.1 | |
|---|---|---|
| 0 | Today last price | 0.6395 |
| 1 | Today Daily Change | -0.0029 |
| 2 | Today Daily Change % | -0.4500 |
| 3 | Today daily open | 0.6424 |
The pair remains strongly bearish on the daily time frame. It trades below the 20 SMA @ 0.6432, 50 SMA 0.6515, 100 SMA @ 0.6601 and 200 SMA @ 0.6695.
| Trends | Trends.1 | |
|---|---|---|
| 0 | Daily SMA20 | 0.6432 |
| 1 | Daily SMA50 | 0.6515 |
| 2 | Daily SMA100 | 0.6601 |
| 3 | Daily SMA200 | 0.6695 |
The previous day high was 0.6447 while the previous day low was 0.6404. The daily 38.2% Fib levels comes at 0.642, expected to provide resistance. Similarly, the daily 61.8% fib level is at 0.6431, expected to provide resistance.
Note the levels of interest below:
- Pivot support is noted at 0.6403, 0.6382, 0.6361
- Pivot resistance is noted at 0.6445, 0.6467, 0.6488
| Levels | Levels.1 |
|---|---|
| Previous Daily High | 0.6447 |
| Previous Daily Low | 0.6404 |
| Previous Weekly High | 0.6511 |
| Previous Weekly Low | 0.6385 |
| Previous Monthly High | 0.6724 |
| Previous Monthly Low | 0.6364 |
| Daily Fibonacci 38.2% | 0.6420 |
| Daily Fibonacci 61.8% | 0.6431 |
| Daily Pivot Point S1 | 0.6403 |
| Daily Pivot Point S2 | 0.6382 |
| Daily Pivot Point S3 | 0.6361 |
| Daily Pivot Point R1 | 0.6445 |
| Daily Pivot Point R2 | 0.6467 |
| Daily Pivot Point R3 | 0.6488 |
[/s2If]
Download Nehcap EAWe have two EAs that are operational on our LIVE accounts.
- EA-FIX: Check out the details here. Download EA-FIX . EA-FIX is a non-grid HFT scalper.
- EA-GROWTH: High quality low dd EA using trend grids. Download EA_GROWTHJoin Our Telegram Group
")


