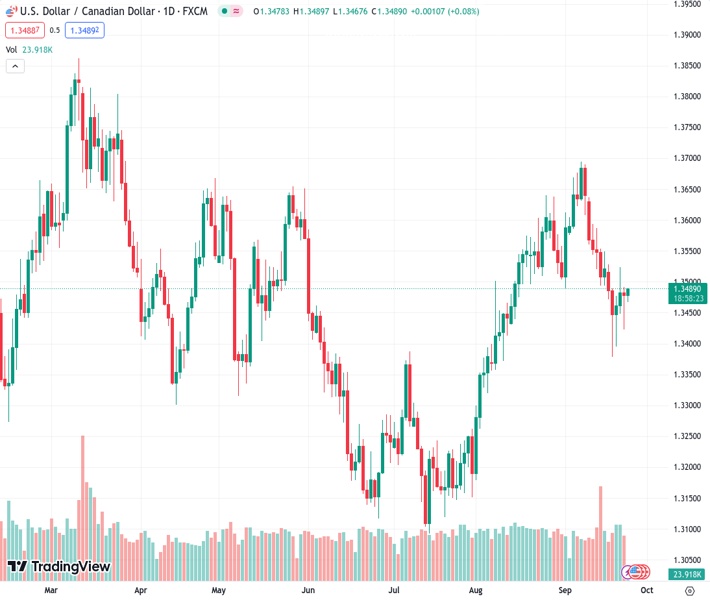
The USDCAD is currently moving horizontally around 1.3476 due to the weakening of the USD.
…
This is a premium post.
[s2If !current_user_can(access_s2member_level4)]Please register for FREE REGISTER to read full post below containing analysis. In case of any error or you think you are not able to read the full post below, please email us at support#nehcap.com [lwa][/s2If] [s2If current_user_can(access_s2member_level1)]
- USD/CAD trades sideways near 1.3476 amid the USD weakness.
The pair currently trades last at 1.34826.
The previous day high was 1.3492 while the previous day low was 1.3424. The daily 38.2% Fib levels comes at 1.3466, expected to provide support. Similarly, the daily 61.8% fib level is at 1.345, expected to provide support.
The USD/CAD pair consolidates its recent gains below the 1.3500 barrier during the early Asian session on Monday. The weakening of the US Dollar (USD) and a decline in the US Treasury bond yields weigh on the pair. As of writing, USD/CAD is trading around 1.3476, losing 0.05% on the day.
Statistics Canada revealed on Friday that Canadian Retail Sales for July rose by 0.3% from the 0.1% in the previous reading, below the market consensus of 0.4%. While, the Core Retail Sales climbed 1.0% from a 0.7% drop in the previous reading, beating the market expectation of 0.5%. Additionally, a rally in oil prices underpins the commodity-linked Loonie and might cap the upside for the USD/CAD pair as the country is the leading oil exporter to the United States.
On the other hand, Presidents of the Federal Reserve Banks of Boston and San Francisco, Susan Collins and Mary Daly, emphasized that although inflation is cooling down. However, further rate hikes would be necessary. That said, the higher-for-longer rate narrative has propelled the US Dollar against its rivals and might act as a tailwind for the USD/CAD pair.
On Friday, the US S&P Global Manufacturing PMI improved to 48.9 in September from 47.9 in August, indicating an ongoing contraction in the manufacturing sector’s business activity. Meanwhile, the Services PMI fell to 50.2 from 50.5 in the previous month. Finally, the Composite PMI dropped to 50.1, down marginally from 50.2 in August.
Looking ahead, market participants will keep an eye on the Canadian Gross Domestic Product (GDP) for July due on Friday. The key event this week will be the US Core Personal Consumption Expenditure (PCE) Price Index, the Fed’s preferred measure of consumer inflation. The annual figure is expected to drop from 4.2% to 3.9%. These figures could give a clear direction to the USD/CAD pair.
Technical Levels: Supports and Resistances
USDCAD currently trading at 1.3482 at the time of writing. Pair opened at 1.3484 and is trading with a change of -0.01 % .
| Overview | Overview.1 | |
|---|---|---|
| 0 | Today last price | 1.3482 |
| 1 | Today Daily Change | -0.0002 |
| 2 | Today Daily Change % | -0.0100 |
| 3 | Today daily open | 1.3484 |
The pair is trading below its 20 Daily moving average @ 1.3552, above its 50 Daily moving average @ 1.3441 , above its 100 Daily moving average @ 1.34 and above its 200 Daily moving average @ 1.3462
| Trends | Trends.1 | |
|---|---|---|
| 0 | Daily SMA20 | 1.3552 |
| 1 | Daily SMA50 | 1.3441 |
| 2 | Daily SMA100 | 1.3400 |
| 3 | Daily SMA200 | 1.3462 |
The previous day high was 1.3492 while the previous day low was 1.3424. The daily 38.2% Fib levels comes at 1.3466, expected to provide support. Similarly, the daily 61.8% fib level is at 1.345, expected to provide support.
Note the levels of interest below:
- Pivot support is noted at 1.3441, 1.3398, 1.3373
- Pivot resistance is noted at 1.3509, 1.3534, 1.3577
| Levels | Levels.1 |
|---|---|
| Previous Daily High | 1.3492 |
| Previous Daily Low | 1.3424 |
| Previous Weekly High | 1.3528 |
| Previous Weekly Low | 1.3379 |
| Previous Monthly High | 1.3640 |
| Previous Monthly Low | 1.3184 |
| Daily Fibonacci 38.2% | 1.3466 |
| Daily Fibonacci 61.8% | 1.3450 |
| Daily Pivot Point S1 | 1.3441 |
| Daily Pivot Point S2 | 1.3398 |
| Daily Pivot Point S3 | 1.3373 |
| Daily Pivot Point R1 | 1.3509 |
| Daily Pivot Point R2 | 1.3534 |
| Daily Pivot Point R3 | 1.3577 |
[/s2If]
Download Nehcap EAWe have two EAs that are operational on our LIVE accounts.
- EA-FIX: Check out the details here. Download EA-FIX . EA-FIX is a non-grid HFT scalper.
- EA-GROWTH: High quality low dd EA using trend grids. Download EA_GROWTHJoin Our Telegram Group
")


