The US dollar to Mexican peso exchange rate is experiencing notable increases, driven by the strength of the US dollar, high US bond yields, and worries surrounding China’s real estate industry, particularly Evergrande’s failure to restructure its debt.
…
This is a premium post.
[s2If !current_user_can(access_s2member_level4)]Please register for FREE REGISTER to read full post below containing analysis. In case of any error or you think you are not able to read the full post below, please email us at support#nehcap.com [lwa][/s2If] [s2If current_user_can(access_s2member_level1)]
- USD/MXN trades with solid gains due to a strong US Dollar, elevated US bond yields, and concerns over China’s property sector, particularly Evergrande’s debt restructuring failure.
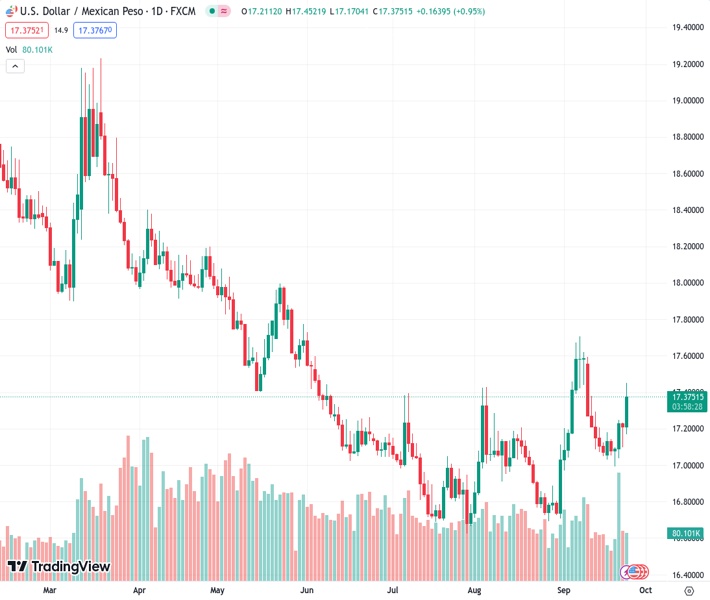
The pair currently trades last at 17.3738.
The previous day high was 17.2374 while the previous day low was 17.1012. The daily 38.2% Fib levels comes at 17.1532, expected to provide support. Similarly, the daily 61.8% fib level is at 17.1854, expected to provide support.
The Mexican Peso (MXN) loses territory against the US Dollar (USD) on Monday, as the last week of Q3 starts with risk-aversion. A strong US Dollar due to higher US bond yields, worries about China’s property sector, and falling commodity prices are the reasons that weakened the MXN. The USD/MXN is trading at 17.3762 after hitting a daily low of 17.1704.
Sentiment remains fragile, though of late, Wall Street has turned green, while the American Dollar (USD), though positive, is back below the 106.00 mark. Us Treasury bond yields remain elevated, with the 10-year at 4.519%.
In the Asian session, news that China’s most prominent developer, Evergrande, failed to restructure its debt deteriorated investors’ sentiment. Meanwhile, minuscule losses in global oil prices weighed on the Mexican currency, which is closely correlated, as a part of its economy heavily depends on oil exports.
Meanwhile, inflation in Mexico continues to decelerate, as reported by the National Statistics Agency, known as INEGI. Headline inflation for the first half of September dropped to 4.44% compared to August’s 4.64%, approaching the Bank of Mexico (Banxico) goal of 3% plus or minus 1%. Meanwhile, analysts are not expecting any rate cuts by Banxico for the rest of 2023. However, if the pace of inflation slows down sharply, that could trigger Banxico adjustments on its monetary policy and cause a depreciation of the Mexican Peso.
Investors’ mood deteriorated as they embraced the “higher for longer” stance. With the US Federal Reserve expected to hike rates again this year, US Treasury bond yields are surging while Wall Street is experiencing difficulties clinging to its gains. The US 10-year Treasury bond yield has reached a level of 4.533%, a level last observed in 2007, a tailwind for the USD/MXN.
Federal Reserve officials, particularly Governor Michelle Bowman, emphasized the need for more rate hikes. In contrast, Boston and San Francisco Fed Presidents Susan Collins and Mary Daly suggested that patience is required but haven’t ruled out another hike. Recently, the Chicago Fed President Austan Goolsbee said that a soft landing is possible, but inflation risks remain tilted to the upside.
Another reason market sentiment is shifting sour is that US lawmakers are warning that the US is headed for a shutdown as budget talks stalled. Once again, US policymakers use the budget as a political tool to push their agenda.
The USD/MXN climbed past the 20- and 100-day moving average (DMA), with the former rising above the latter and the 50-DMA, suggesting that the uptrend could accelerate and the pair has found its foot. If the exotic pair crosses the September 7 swing high at 17.7074, the most likely scenario would see the USD/MXN challenging the 200-DMA at 17.8716 before challenging the 18.0000 figure. Conversely, the pair could retest last week’s low of 16.9925 if sellers reclaim the 17.1851/19.55 area.
Technical Levels: Supports and Resistances
USDMXN currently trading at 17.3611 at the time of writing. Pair opened at 17.211 and is trading with a change of 0.87 % .
| Overview | Overview.1 | |
|---|---|---|
| 0 | Today last price | 17.3611 |
| 1 | Today Daily Change | 0.1501 |
| 2 | Today Daily Change % | 0.8700 |
| 3 | Today daily open | 17.2110 |
The pair is trading above its 20 Daily moving average @ 17.171, above its 50 Daily moving average @ 17.0383 , above its 100 Daily moving average @ 17.1956 and below its 200 Daily moving average @ 17.892
| Trends | Trends.1 | |
|---|---|---|
| 0 | Daily SMA20 | 17.1710 |
| 1 | Daily SMA50 | 17.0383 |
| 2 | Daily SMA100 | 17.1956 |
| 3 | Daily SMA200 | 17.8920 |
The previous day high was 17.2374 while the previous day low was 17.1012. The daily 38.2% Fib levels comes at 17.1532, expected to provide support. Similarly, the daily 61.8% fib level is at 17.1854, expected to provide support.
Note the levels of interest below:
- Pivot support is noted at 17.129, 17.047, 16.9927
- Pivot resistance is noted at 17.2652, 17.3194, 17.4014
| Levels | Levels.1 |
|---|---|
| Previous Daily High | 17.2374 |
| Previous Daily Low | 17.1012 |
| Previous Weekly High | 17.2506 |
| Previous Weekly Low | 16.9982 |
| Previous Monthly High | 17.4274 |
| Previous Monthly Low | 16.6945 |
| Daily Fibonacci 38.2% | 17.1532 |
| Daily Fibonacci 61.8% | 17.1854 |
| Daily Pivot Point S1 | 17.1290 |
| Daily Pivot Point S2 | 17.0470 |
| Daily Pivot Point S3 | 16.9927 |
| Daily Pivot Point R1 | 17.2652 |
| Daily Pivot Point R2 | 17.3194 |
| Daily Pivot Point R3 | 17.4014 |
[/s2If]
Download Nehcap EAWe have two EAs that are operational on our LIVE accounts.
- EA-FIX: Check out the details here. Download EA-FIX . EA-FIX is a non-grid HFT scalper.
- EA-GROWTH: High quality low dd EA using trend grids. Download EA_GROWTHJoin Our Telegram Group
")


