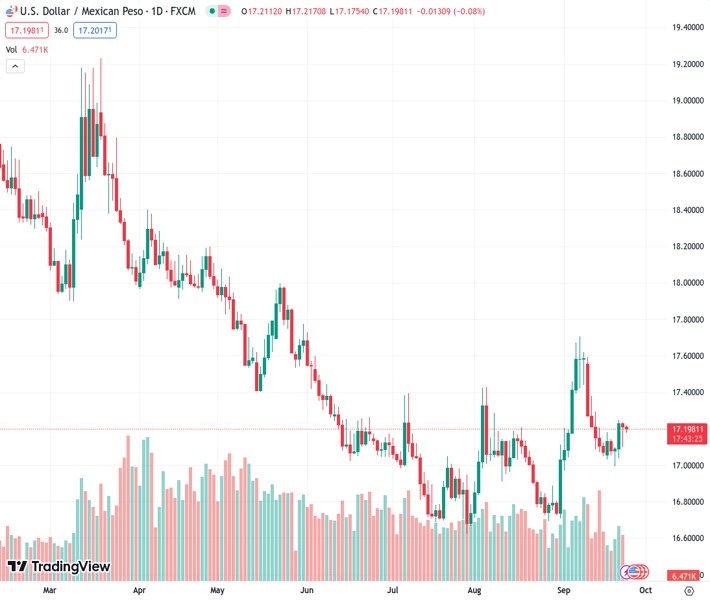
The US dollar to Mexican peso exchange rate at 17.2009 is facing difficulties in making significant progress and is fluctuating within a certain range on Monday.
…
This is a premium post.
[s2If !current_user_can(access_s2member_level4)]Please register for FREE REGISTER to read full post below containing analysis. In case of any error or you think you are not able to read the full post below, please email us at support#nehcap.com [lwa][/s2If] [s2If current_user_can(access_s2member_level1)]
- USD/MXN struggles to gain any meaningful traction and oscillates in a range on Monday.
The pair currently trades last at 17.2009.
The previous day high was 17.2374 while the previous day low was 17.1012. The daily 38.2% Fib levels comes at 17.1532, expected to provide support. Similarly, the daily 61.8% fib level is at 17.1854, expected to provide support.
The USD/MXN pair manages to defend the 100-day Simple Moving Average (SMA) support through the Asian session on Monday, albeit struggles to gain any meaningful traction. Spot prices remain below the 17.2500 area, or last week’s swing high, which should now act as a pivotal point for short-term traders.
With technical indicators on the daily chart holding in the positive territory, a sustained strength beyond should pave the way for some meaningful upside and lift the USD/MXN pair to the 17.3810 area (September 12 peak). Some follow-through buying has the potential to lift spot prices further towards the next relevant hurdle near the 17.5910-17.5960 horizontal zone en route to the monthly top, around the 17.7090-17.7095 region.
The US Dollar (USD) holds steady just below its highest level in more than six months and remains well supported by the Federal Reserve’s (Fed) hawkish outlook, signalling the need to keep rates higher for longer to push inflation to the 2% target. This, along with the reduction in the expected number of rate cuts in 2024, continues to push the US bond yields higher and continues to underpin the USD, favouring the USD/MXN bulls.
Hence, any meaningful slide below the 100-day SMA might continue to attract fresh buyers near the 17.1010-17.0650 horizontal support. This, in turn, should help limit the downside for the USD/MXN pair near last week’s swing low, around the 16.9980 area. which if broken decisively might shift the bias in favour of bearish traders. Spot prices might then turn vulnerable to retesting the 16.6945 area, or a multi-year low touched in August.
Technical Levels: Supports and Resistances
USDMXN currently trading at 17.2097 at the time of writing. Pair opened at 17.211 and is trading with a change of -0.01 % .
| Overview | Overview.1 | |
|---|---|---|
| 0 | Today last price | 17.2097 |
| 1 | Today Daily Change | -0.0013 |
| 2 | Today Daily Change % | -0.0100 |
| 3 | Today daily open | 17.2110 |
The pair is trading above its 20 Daily moving average @ 17.171, above its 50 Daily moving average @ 17.0383 , above its 100 Daily moving average @ 17.1956 and below its 200 Daily moving average @ 17.892
| Trends | Trends.1 | |
|---|---|---|
| 0 | Daily SMA20 | 17.1710 |
| 1 | Daily SMA50 | 17.0383 |
| 2 | Daily SMA100 | 17.1956 |
| 3 | Daily SMA200 | 17.8920 |
The previous day high was 17.2374 while the previous day low was 17.1012. The daily 38.2% Fib levels comes at 17.1532, expected to provide support. Similarly, the daily 61.8% fib level is at 17.1854, expected to provide support.
Note the levels of interest below:
- Pivot support is noted at 17.129, 17.047, 16.9927
- Pivot resistance is noted at 17.2652, 17.3194, 17.4014
| Levels | Levels.1 |
|---|---|
| Previous Daily High | 17.2374 |
| Previous Daily Low | 17.1012 |
| Previous Weekly High | 17.2506 |
| Previous Weekly Low | 16.9982 |
| Previous Monthly High | 17.4274 |
| Previous Monthly Low | 16.6945 |
| Daily Fibonacci 38.2% | 17.1532 |
| Daily Fibonacci 61.8% | 17.1854 |
| Daily Pivot Point S1 | 17.1290 |
| Daily Pivot Point S2 | 17.0470 |
| Daily Pivot Point S3 | 16.9927 |
| Daily Pivot Point R1 | 17.2652 |
| Daily Pivot Point R2 | 17.3194 |
| Daily Pivot Point R3 | 17.4014 |
[/s2If]
Download Nehcap EAWe have two EAs that are operational on our LIVE accounts.
- EA-FIX: Check out the details here. Download EA-FIX . EA-FIX is a non-grid HFT scalper.
- EA-GROWTH: High quality low dd EA using trend grids. Download EA_GROWTHJoin Our Telegram Group
")


