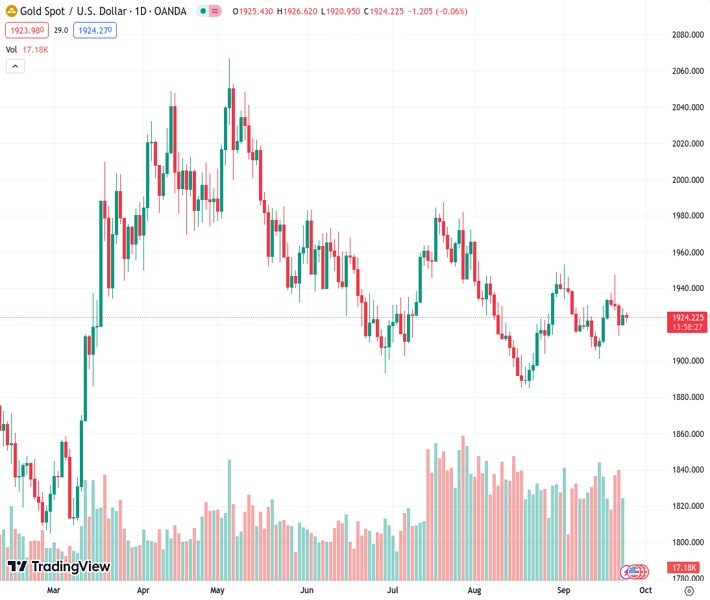
The price of gold, represented by #XAUUSD at 1,924.13, is struggling to maintain its momentum around the $1,920 level and remains below the 50- and 100-hour exponential moving averages (EMAs).
…
This is a premium post.
[s2If !current_user_can(access_s2member_level4)]Please register for FREE REGISTER to read full post below containing analysis. In case of any error or you think you are not able to read the full post below, please email us at support#nehcap.com [lwa][/s2If] [s2If current_user_can(access_s2member_level1)]
- Gold price loses traction near $1,920, holds below the 50- and 100-hour EMAs.
The pair currently trades last at 1924.13.
The previous day high was 1929.16 while the previous day low was 1919.52. The daily 38.2% Fib levels comes at 1925.48, expected to provide resistance. Similarly, the daily 61.8% fib level is at 1923.2, expected to provide support.
Gold price (XAU/USD) loses momentum around $1,920 during the early European session on Monday. Meanwhile, the US Dollar Index (DXY) attracts some buyers and hovers around 105.60, near the highest level since March 2023.
That said, the higher-for-longer interest rate narratives in the US is the main driver to lift the US Dollar, which drags gold price lower. It’s worth noting that rising interest rates raise the opportunity cost of investing in non-yielding assets, implying a negative outlook for XAU/USD.
Looking ahead, the release of the US Gross Domestic Product (GDP) Annualized for the second quarter on Thursday and the Core Personal Consumption Expenditure (PCE) Price Index, the Fed’s preferred measure of consumer inflation on Friday will be closely watched by traders. The annual figure is expected to drop from 4.2% to 3.9%. Market players will take cues from these figures and find a clear direction in XAU/USD.
On the four-hour chart, gold price holds below the 50- and 100-hour Exponential Moving Averages (EMAs), which means the past of least resistance is to the downside. Meanwhile, the Relative Strength Index (RSI) is located in bearish territory below 50, activating the bearish momentum for gold price.
Resistance level: $1,945, $1,970 and $1,985
Support level: $1,915, $1,900 and $1,885
Technical Levels: Supports and Resistances
XAUUSD currently trading at 1922.45 at the time of writing. Pair opened at 1925.26 and is trading with a change of -0.15 % .
| Overview | Overview.1 | |
|---|---|---|
| 0 | Today last price | 1922.45 |
| 1 | Today Daily Change | -2.81 |
| 2 | Today Daily Change % | -0.15 |
| 3 | Today daily open | 1925.26 |
The pair remains strongly bearish on the daily time frame. It trades below the 20 SMA @ 1925.97, 50 SMA 1930.03, 100 SMA @ 1942.27 and 200 SMA @ 1925.57.
| Trends | Trends.1 | |
|---|---|---|
| 0 | Daily SMA20 | 1925.97 |
| 1 | Daily SMA50 | 1930.03 |
| 2 | Daily SMA100 | 1942.27 |
| 3 | Daily SMA200 | 1925.57 |
The previous day high was 1929.16 while the previous day low was 1919.52. The daily 38.2% Fib levels comes at 1925.48, expected to provide resistance. Similarly, the daily 61.8% fib level is at 1923.2, expected to provide support.
Note the levels of interest below:
- Pivot support is noted at 1920.13, 1915.01, 1910.49
- Pivot resistance is noted at 1929.77, 1934.29, 1939.41
| Levels | Levels.1 |
|---|---|
| Previous Daily High | 1929.16 |
| Previous Daily Low | 1919.52 |
| Previous Weekly High | 1947.47 |
| Previous Weekly Low | 1913.95 |
| Previous Monthly High | 1966.08 |
| Previous Monthly Low | 1884.85 |
| Daily Fibonacci 38.2% | 1925.48 |
| Daily Fibonacci 61.8% | 1923.20 |
| Daily Pivot Point S1 | 1920.13 |
| Daily Pivot Point S2 | 1915.01 |
| Daily Pivot Point S3 | 1910.49 |
| Daily Pivot Point R1 | 1929.77 |
| Daily Pivot Point R2 | 1934.29 |
| Daily Pivot Point R3 | 1939.41 |
[/s2If]
Download Nehcap EAWe have two EAs that are operational on our LIVE accounts.
- EA-FIX: Check out the details here. Download EA-FIX . EA-FIX is a non-grid HFT scalper.
- EA-GROWTH: High quality low dd EA using trend grids. Download EA_GROWTHJoin Our Telegram Group
")


