The divergence between the USDCHF pair grows larger due to the increasing value of the US Dollar and the decrease in value of the Swiss Franc.
…
This is a premium post.
[s2If !current_user_can(access_s2member_level4)]Please register for FREE REGISTER to read full post below containing analysis. In case of any error or you think you are not able to read the full post below, please email us at support#nehcap.com [lwa][/s2If] [s2If current_user_can(access_s2member_level1)]
- The USD/CHF differential continues to widen as the US Dollar gains strength and the Swiss Franc swoons.
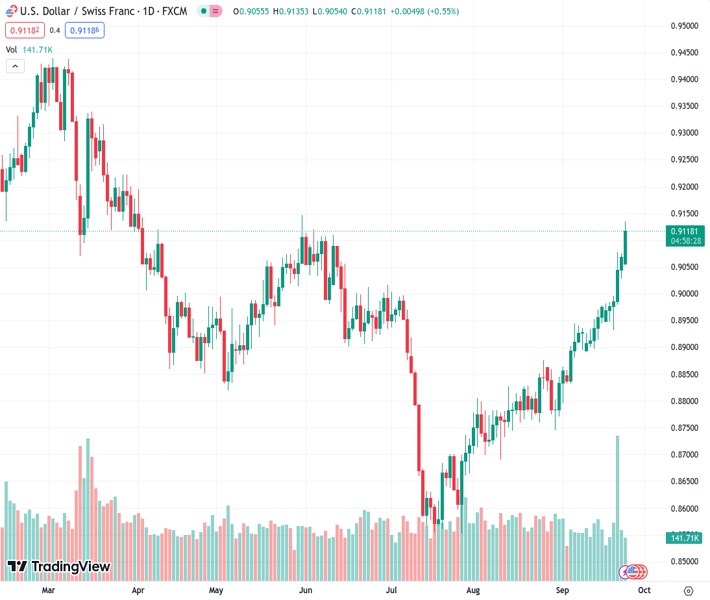
The pair currently trades last at 0.91211.
The previous day high was 0.9075 while the previous day low was 0.9038. The daily 38.2% Fib levels comes at 0.9061, expected to provide support. Similarly, the daily 61.8% fib level is at 0.9052, expected to provide support.
The USD/CHF is pinned to the high side in Monday trading, reaching the 0.9130 region. Another move higher will have the pair testing into new five-month highs.
Last week, the Swiss National Bank (SNB) was unceremoniously knocked off its rate hike cycle, surprising markets and flubbing investor expectations when the SNB failed to raise rates another 25 basis points last Thursday.
Inflation figures for the Swiss domestic economy have been unwinding much faster than the SNB initially thought, and the Swiss central bank was forced to pull the plug on its current rate hike schedule.
The Greenback (USD) continues to firm up in markets, bolstered by last week’s hawkish Federal Reserve (Fed) showing; while both central banks held rates steady last week, it’s the Fed that gets the benefit of the doubt in markets, with the US central bank seeing interest rates staying higher for longer than previously forecast.
This week sees a quiet start to things on the economic calendar, with mid-tier data on offering until Thursday’s US Gross Domestic Product (GDP) printing.
Tuesday will bring US housing and consumer confidence figures, while CHF traders will want to keep an eye on Wednesday’s ZEW sentiment expectations and the SNB’s quarterly bulletin.
Bullish momentum for the US Dollar is pushing the USD/CHF pair higher, and hourly candles are accelerating into the top end. The pair is up over 2% from last week’s low near 0.8930, and a fresh push higher will put the pair into new five-month highs.
Daily candlesticks see the USD/CHF pushing above the 200-day Simple Moving Average (SMA) which currently sits near 0.9050, and the 34-day Exponential Moving Average (EMA) has turned bullish, crossing over the 100-day SMA near 0.8900 and set to give prices technical support.
The next significant resistance zone sits at March’s swing highs near the 0.9400 handle.
Technical Levels: Supports and Resistances
USDCHF currently trading at 0.9119 at the time of writing. Pair opened at 0.9067 and is trading with a change of 0.57 % .
| Overview | Overview.1 | |
|---|---|---|
| 0 | Today last price | 0.9119 |
| 1 | Today Daily Change | 0.0052 |
| 2 | Today Daily Change % | 0.5700 |
| 3 | Today daily open | 0.9067 |
The pair remains strongly bullish on the daily timeframe. It trades above its 20 SMA @ 0.8917, 50 SMA 0.8806, 100 SMA @ 0.8886 and 200 SMA @ 0.9035.
| Trends | Trends.1 | |
|---|---|---|
| 0 | Daily SMA20 | 0.8917 |
| 1 | Daily SMA50 | 0.8806 |
| 2 | Daily SMA100 | 0.8886 |
| 3 | Daily SMA200 | 0.9035 |
The previous day high was 0.9075 while the previous day low was 0.9038. The daily 38.2% Fib levels comes at 0.9061, expected to provide support. Similarly, the daily 61.8% fib level is at 0.9052, expected to provide support.
Note the levels of interest below:
- Pivot support is noted at 0.9045, 0.9023, 0.9007
- Pivot resistance is noted at 0.9082, 0.9098, 0.912
| Levels | Levels.1 |
|---|---|
| Previous Daily High | 0.9075 |
| Previous Daily Low | 0.9038 |
| Previous Weekly High | 0.9078 |
| Previous Weekly Low | 0.8932 |
| Previous Monthly High | 0.8876 |
| Previous Monthly Low | 0.8690 |
| Daily Fibonacci 38.2% | 0.9061 |
| Daily Fibonacci 61.8% | 0.9052 |
| Daily Pivot Point S1 | 0.9045 |
| Daily Pivot Point S2 | 0.9023 |
| Daily Pivot Point S3 | 0.9007 |
| Daily Pivot Point R1 | 0.9082 |
| Daily Pivot Point R2 | 0.9098 |
| Daily Pivot Point R3 | 0.9120 |
[/s2If]
Download Nehcap EAWe have two EAs that are operational on our LIVE accounts.
- EA-FIX: Check out the details here. Download EA-FIX . EA-FIX is a non-grid HFT scalper.
- EA-GROWTH: High quality low dd EA using trend grids. Download EA_GROWTHJoin Our Telegram Group
")


