Fresh buying interest emerges in the USD/INR currency pair at a rate of 83.1075 on Monday as the bullish US dollar provides additional support.
…
This is a premium post.
[s2If !current_user_can(access_s2member_level4)]Please register for FREE REGISTER to read full post below containing analysis. In case of any error or you think you are not able to read the full post below, please email us at support#nehcap.com [lwa][/s2If] [s2If current_user_can(access_s2member_level1)]
- USD/INR catches fresh bids on Monday and draws support from a bullish USD.
The pair currently trades last at 83.1075.
The previous day high was 83.2444 while the previous day low was 82.5125. The daily 38.2% Fib levels comes at 82.7921, expected to provide support. Similarly, the daily 61.8% fib level is at 82.9648, expected to provide support.
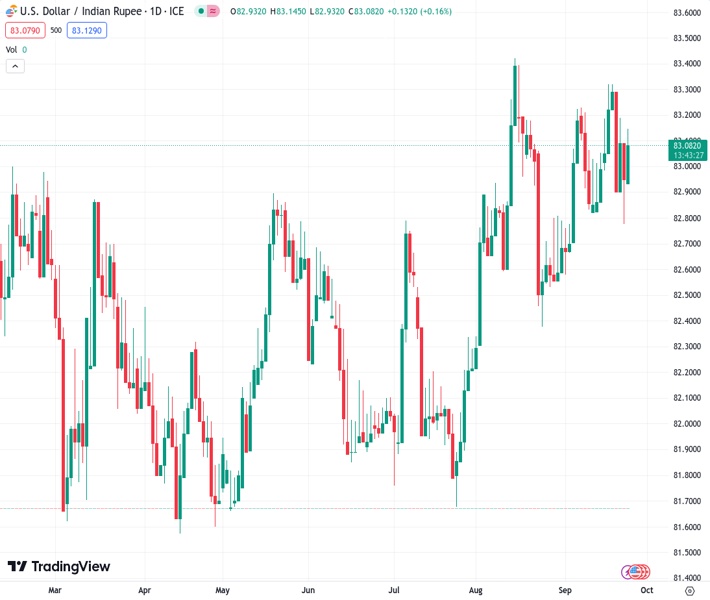
The USD/INR pair regains positive traction on the first day of a new week and moves away from a nearly three-week low, around the 82.80-82.75 region touched on Friday. Spot prices stick to intraday gains through the early part of the European session and currently trade above the 83.00 round-figure mark.
The prospects for further policy tightening by the Federal Reserve (Fed) remain supportive of elevated US Treasury bond yields and assist the US Dollar (USD) to hold steady near its highest level in more than six months. Apart from this, persistent worries about a property market crisis in China further benefit the Greenback’s relative safe-haven status and act as a tailwind for the USD/INR pair.
From a technical perspective, neutral oscillators on the daily chart warrant some caution before positioning for further intraday appreciating move. Hence, any subsequent strength is likely to confront resistance near the 82.30 zone ahead of the all-time peak, around the 83.40-83.45 region touched on August 15, which if cleared decisively should allow the USD/INR pair to conquer the 84.00 round figure.
On the flip side, the 82.80-82.75 region, or Friday’s swing low should protect the immediate downside. This is closely followed by the upward-sloping 100-day Simple Moving Average (SMA), currently pegged near the mid-82.00s, and the 200-day SMA, around the 82.35 region. The latter should act as a key pivotal point for the USD/INR pair and a convincing break below will be seen as a fresh trigger for bears.
Spot prices might then turn vulnerable to accelerate the slide towards the 82.00 mark. The downward trajectory could get extended further and eventually drag the USD/INR pair to the July swing low, around the 81.70-81.65 region.
Technical Levels: Supports and Resistances
USDINR currently trading at 83.1125 at the time of writing. Pair opened at 83.0965 and is trading with a change of 0.02 % .
| Overview | Overview.1 | |
|---|---|---|
| 0 | Today last price | 83.1125 |
| 1 | Today Daily Change | 0.0160 |
| 2 | Today Daily Change % | 0.0200 |
| 3 | Today daily open | 83.0965 |
The pair remains strongly bullish on the daily timeframe. It trades above its 20 SMA @ 82.9933, 50 SMA 82.762, 100 SMA @ 82.5335 and 200 SMA @ 82.3614.
| Trends | Trends.1 | |
|---|---|---|
| 0 | Daily SMA20 | 82.9933 |
| 1 | Daily SMA50 | 82.7620 |
| 2 | Daily SMA100 | 82.5335 |
| 3 | Daily SMA200 | 82.3614 |
The previous day high was 83.2444 while the previous day low was 82.5125. The daily 38.2% Fib levels comes at 82.7921, expected to provide support. Similarly, the daily 61.8% fib level is at 82.9648, expected to provide support.
Note the levels of interest below:
- Pivot support is noted at 82.6579, 82.2193, 81.926
- Pivot resistance is noted at 83.3897, 83.683, 84.1216
| Levels | Levels.1 |
|---|---|
| Previous Daily High | 83.2444 |
| Previous Daily Low | 82.5125 |
| Previous Weekly High | 83.8456 |
| Previous Weekly Low | 82.5125 |
| Previous Monthly High | 83.5505 |
| Previous Monthly Low | 82.2240 |
| Daily Fibonacci 38.2% | 82.7921 |
| Daily Fibonacci 61.8% | 82.9648 |
| Daily Pivot Point S1 | 82.6579 |
| Daily Pivot Point S2 | 82.2193 |
| Daily Pivot Point S3 | 81.9260 |
| Daily Pivot Point R1 | 83.3897 |
| Daily Pivot Point R2 | 83.6830 |
| Daily Pivot Point R3 | 84.1216 |
[/s2If]
Download Nehcap EAWe have two EAs that are operational on our LIVE accounts.
- EA-FIX: Check out the details here. Download EA-FIX . EA-FIX is a non-grid HFT scalper.
- EA-GROWTH: High quality low dd EA using trend grids. Download EA_GROWTHJoin Our Telegram Group
")


