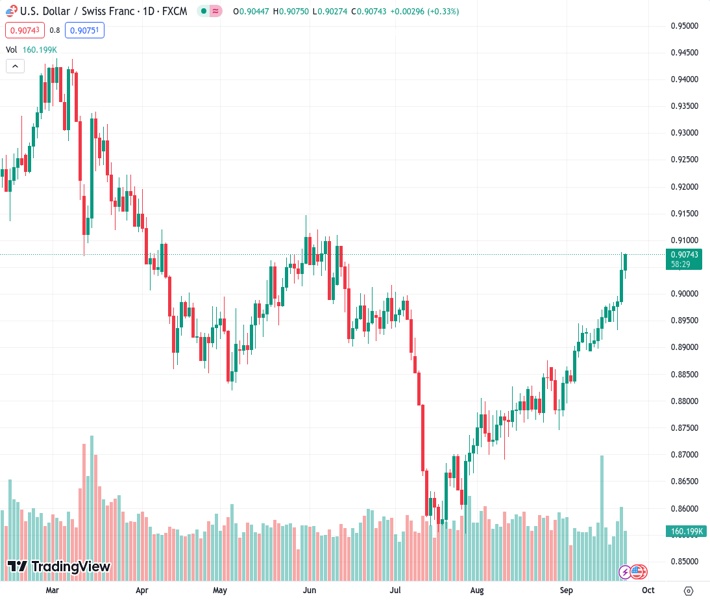
The USDCHF pair at 0.90720 is moving in a bullish direction, concluding the week with an increase of more than 1% in value.
…
This is a premium post.
[s2If !current_user_can(access_s2member_level4)]Please register for FREE REGISTER to read full post below containing analysis. In case of any error or you think you are not able to read the full post below, please email us at support#nehcap.com [lwa][/s2If] [s2If current_user_can(access_s2member_level1)]
- USD/CHF is on a bullish trajectory, ending the week with over 1% gains,
The pair currently trades last at 0.90720.
The previous day high was 0.9078 while the previous day low was 0.8983. The daily 38.2% Fib levels comes at 0.9042, expected to provide support. Similarly, the daily 61.8% fib level is at 0.9019, expected to provide support.
USD/CHF is set to end the week with decent gains of more than 1%, while breaking above the 200-day moving average (DMA), which could open the door for further upside, with buyers eyeing a new cycle high. Therefore, the pair is trading at 0.9071, edges up 0.30% late in the New York session.
The daily chart portrays the pair extending its gain past the 0.9032 (200-DMA), and puts a challenge of the 0.9100 figure into play. A breach of the latter will expose the May 31 cycle high at 0.9147, which, if cleared, the USD/CHF could rally back to the March 16 daily high at 0.9340.
Conversely, sellers would face the 200-DMA and the 0.9000 mark. Those two levels hurdled, and the USD/CHF would dive and test the September 20 daily low of 0.8931 before testing the 0.8900 figure.
Technical Levels: Supports and Resistances
USDCHF currently trading at 0.907 at the time of writing. Pair opened at 0.9045 and is trading with a change of 0.28 % .
| Overview | Overview.1 | |
|---|---|---|
| 0 | Today last price | 0.9070 |
| 1 | Today Daily Change | 0.0025 |
| 2 | Today Daily Change % | 0.2800 |
| 3 | Today daily open | 0.9045 |
The pair remains strongly bullish on the daily timeframe. It trades above its 20 SMA @ 0.8906, 50 SMA 0.8797, 100 SMA @ 0.8884 and 200 SMA @ 0.9036.
| Trends | Trends.1 | |
|---|---|---|
| 0 | Daily SMA20 | 0.8906 |
| 1 | Daily SMA50 | 0.8797 |
| 2 | Daily SMA100 | 0.8884 |
| 3 | Daily SMA200 | 0.9036 |
The previous day high was 0.9078 while the previous day low was 0.8983. The daily 38.2% Fib levels comes at 0.9042, expected to provide support. Similarly, the daily 61.8% fib level is at 0.9019, expected to provide support.
Note the levels of interest below:
- Pivot support is noted at 0.8992, 0.894, 0.8897
- Pivot resistance is noted at 0.9088, 0.9131, 0.9184
| Levels | Levels.1 |
|---|---|
| Previous Daily High | 0.9078 |
| Previous Daily Low | 0.8983 |
| Previous Weekly High | 0.8978 |
| Previous Weekly Low | 0.8897 |
| Previous Monthly High | 0.8876 |
| Previous Monthly Low | 0.8690 |
| Daily Fibonacci 38.2% | 0.9042 |
| Daily Fibonacci 61.8% | 0.9019 |
| Daily Pivot Point S1 | 0.8992 |
| Daily Pivot Point S2 | 0.8940 |
| Daily Pivot Point S3 | 0.8897 |
| Daily Pivot Point R1 | 0.9088 |
| Daily Pivot Point R2 | 0.9131 |
| Daily Pivot Point R3 | 0.9184 |
[/s2If]
Download Nehcap EAWe have two EAs that are operational on our LIVE accounts.
- EA-FIX: Check out the details here. Download EA-FIX . EA-FIX is a non-grid HFT scalper.
- EA-GROWTH: High quality low dd EA using trend grids. Download EA_GROWTHJoin Our Telegram Group
")


