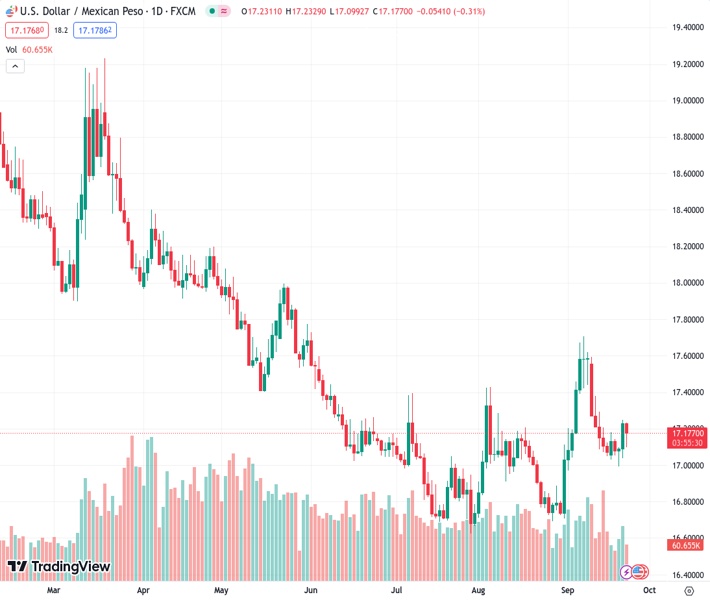
The US dollar to Mexican peso exchange rate, currently at 17.1756, has slightly decreased by 0.48% due to optimistic market sentiment and a weaker US dollar.
…
This is a premium post.
[s2If !current_user_can(access_s2member_level4)]Please register for FREE REGISTER to read full post below containing analysis. In case of any error or you think you are not able to read the full post below, please email us at support#nehcap.com [lwa][/s2If] [s2If current_user_can(access_s2member_level1)]
- USD/MXN edges lower by 0.48% on positive market sentiment and a weakened US Dollar.
The pair currently trades last at 17.1756.
The previous day high was 17.2506 while the previous day low was 17.0639. The daily 38.2% Fib levels comes at 17.1793, expected to provide resistance. Similarly, the daily 61.8% fib level is at 17.1352, expected to provide support.
The emerging market currency the Mexican Peso (MXN) counterattacks the US Dollar (USD) after the exotic pair reached a weekly high of 17.2489, but it has trimmed those gains. At the time of writing, the USD/MXN changes hands at 17.1478, down 0.48%.
Market sentiment remains positive, as shown by US equities trading with gains. Business activity in the United States (US) presented minuscule changes as revealed by S&P Global, with Manufacturing activity improving but standing in recessionary territory. Although expanded, the Services and Composite PMIs portrayed the country’s economic slowdown.
Federal Reserve’s officials had been unleashed on the central bank space, led by the Boston Fed President Susan Collins. She suggested the possibility of further tightening while emphasizing the need for patience. Fed Governor Michell Bowman strongly determined that more rate hikes are necessary to control inflation.
Despite US central bank policymakers’ hawkish rhetoric, the buck stands pressured. The US Dollar Index (DXY), which tracks the buck’s value vs. a basket of six currencies, prints minimal gains of 0.07%, at 10.45. Plunging US Treasury bond yields are a headwind for the USD/MXN, while also a tranche of upbeat Mexican data, supported the Peso.
Inflation in Mexico slowed down for the first half of September, hitting 4.44% YoY, down from 4.64% in August, below 4.46% forecasts. At the same time, the core Consumer Price Index rose 5.78%, above estimates of 5.76% YoY, but below August’s 6.21%. It should be said the Bank of Mexico (Banxico) held rates unchanged at 11.25% in the latest monetary policy meeting and emphasized the need to hold rates for a long period of time.
Given the backdrop, further USD/MXN downside is expected but capped around the 17.0000 figure. Traders should know about political developments, as Mexico is headed for general elections. That, alongside the latest economic budget beginning to generate worries about a revision of the country’s credit rating, can weigh on the Mexican Peso.
Although the USD/MXN pair is set to finish the week with gains, price action has failed to achieve a new cycle high, with buyers eyeing the September 7 high at 17.7074. A breach of that level could open the door to test the 18.0000 figure, but it must reclaim the 100-day moving average (DMA) at 17.1888. On the downside, the pair’s fall is cushioned by the 50-DMA at 17.0302, before challenging 17.0000.
Technical Levels: Supports and Resistances
USDMXN currently trading at 17.181 at the time of writing. Pair opened at 17.234 and is trading with a change of -0.31 % .
| Overview | Overview.1 | |
|---|---|---|
| 0 | Today last price | 17.181 |
| 1 | Today Daily Change | -0.053 |
| 2 | Today Daily Change % | -0.310 |
| 3 | Today daily open | 17.234 |
The pair is trading above its 20 Daily moving average @ 17.1481, above its 50 Daily moving average @ 17.0291 , below its 100 Daily moving average @ 17.2011 and below its 200 Daily moving average @ 17.9049
| Trends | Trends.1 | |
|---|---|---|
| 0 | Daily SMA20 | 17.1481 |
| 1 | Daily SMA50 | 17.0291 |
| 2 | Daily SMA100 | 17.2011 |
| 3 | Daily SMA200 | 17.9049 |
The previous day high was 17.2506 while the previous day low was 17.0639. The daily 38.2% Fib levels comes at 17.1793, expected to provide resistance. Similarly, the daily 61.8% fib level is at 17.1352, expected to provide support.
Note the levels of interest below:
- Pivot support is noted at 17.115, 16.9961, 16.9283
- Pivot resistance is noted at 17.3018, 17.3696, 17.4885
| Levels | Levels.1 |
|---|---|
| Previous Daily High | 17.2506 |
| Previous Daily Low | 17.0639 |
| Previous Weekly High | 17.5959 |
| Previous Weekly Low | 17.0504 |
| Previous Monthly High | 17.4274 |
| Previous Monthly Low | 16.6945 |
| Daily Fibonacci 38.2% | 17.1793 |
| Daily Fibonacci 61.8% | 17.1352 |
| Daily Pivot Point S1 | 17.1150 |
| Daily Pivot Point S2 | 16.9961 |
| Daily Pivot Point S3 | 16.9283 |
| Daily Pivot Point R1 | 17.3018 |
| Daily Pivot Point R2 | 17.3696 |
| Daily Pivot Point R3 | 17.4885 |
[/s2If]
Download Nehcap EAWe have two EAs that are operational on our LIVE accounts.
- EA-FIX: Check out the details here. Download EA-FIX . EA-FIX is a non-grid HFT scalper.
- EA-GROWTH: High quality low dd EA using trend grids. Download EA_GROWTHJoin Our Telegram Group
")


