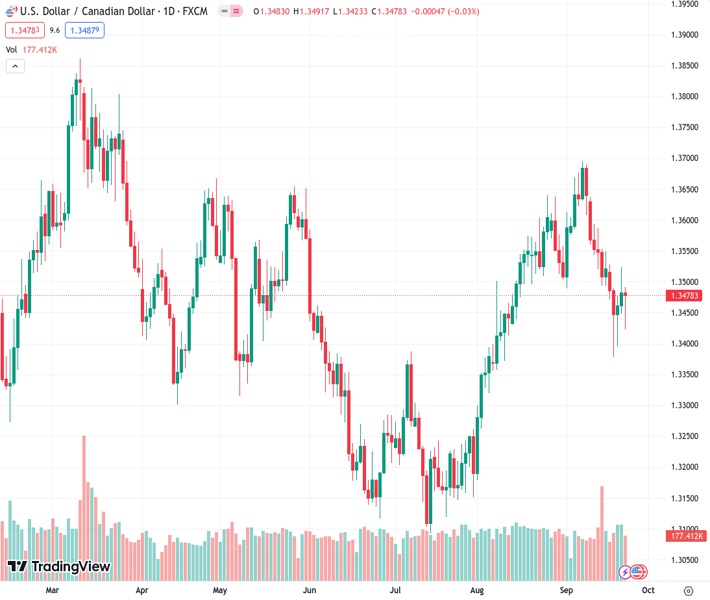
The US dollar is rebounding against the Canadian dollar on Friday, following a decline to 1.3425.
…
This is a premium post.
[s2If !current_user_can(access_s2member_level4)]Please register for FREE REGISTER to read full post below containing analysis. In case of any error or you think you are not able to read the full post below, please email us at support#nehcap.com [lwa][/s2If] [s2If current_user_can(access_s2member_level1)]
- The USD/CAD is recovering for Friday after slipping to 1.3425.
The pair currently trades last at 1.34794.
The previous day high was 1.3524 while the previous day low was 1.3453. The daily 38.2% Fib levels comes at 1.3497, expected to provide resistance. Similarly, the daily 61.8% fib level is at 1.348, expected to provide resistance.
The USD/CAD is set to finish out Friday near where it started, trading just south of 1.3490.
The Loonie (CAD) has twisted through the back half of the trading week, with the CAD and (Greenback) playing tug-of-war.
Rising oil prices have been boosting the CAD lately, but a break in crude gains sees the USD/CAD testing back into recovery territory.
Canadian Retail Sales rose 0.3% in July, slightly below market expectations of 0.4% but an improvement on the previous month’s -0.7%, which was revised upwards from -0.8%.
Core Retail Sales (retail sales figures less automobiles) rose 1% for the same period, breezing past analyst forecasts of 0.5%.
On the US side, Purchasing Manager Index (PMI) figures came in mixed, seeing a brief slip in the US Dollar but capping off the potential for a determined move in either direction for the USD.
The preliminary US S&P Global Manufacturing PMI for September climbed to 48.9 against the expected 48, easily clearing expectations. The Services PMI component slipped analyst forecasts, dipping to 50.2 and reversing the expected improvement to 50.6.
Read more:
US S&P Global Manufacturing PMI improves to 48.9, Services PMI declines to 50.2 in September
The economic calendar is on the thin side for next week, but investors will be keeping one eye out for US Durable Goods Orders next Wednesday. Markets are expecting durable goods orders for August to print at -0.4%, a declining figure but still an improvement from the previous period’s 5.2% decline.
The USD/CAD is trying to recover from near-term lows into 1.3380, and is seeing the 200-hour Simple Moving Average (SMA), currently capping off intraday action from 1.3500.
The pair is 1.6% down from September’s peak just below the 1.3700 handle.
Daily candlesticks sees the USD/CAD stuck into the 200-day SMA, and market sentiment could flow in either direction moving forward.
Technical Levels: Supports and Resistances
USDCAD currently trading at 1.3479 at the time of writing. Pair opened at 1.3484 and is trading with a change of -0.04 % .
| Overview | Overview.1 | |
|---|---|---|
| 0 | Today last price | 1.3479 |
| 1 | Today Daily Change | -0.0005 |
| 2 | Today Daily Change % | -0.0400 |
| 3 | Today daily open | 1.3484 |
The pair is trading below its 20 Daily moving average @ 1.3558, above its 50 Daily moving average @ 1.3436 , above its 100 Daily moving average @ 1.3398 and above its 200 Daily moving average @ 1.3463
| Trends | Trends.1 | |
|---|---|---|
| 0 | Daily SMA20 | 1.3558 |
| 1 | Daily SMA50 | 1.3436 |
| 2 | Daily SMA100 | 1.3398 |
| 3 | Daily SMA200 | 1.3463 |
The previous day high was 1.3524 while the previous day low was 1.3453. The daily 38.2% Fib levels comes at 1.3497, expected to provide resistance. Similarly, the daily 61.8% fib level is at 1.348, expected to provide resistance.
Note the levels of interest below:
- Pivot support is noted at 1.345, 1.3416, 1.3379
- Pivot resistance is noted at 1.352, 1.3558, 1.3591
| Levels | Levels.1 |
|---|---|
| Previous Daily High | 1.3524 |
| Previous Daily Low | 1.3453 |
| Previous Weekly High | 1.3639 |
| Previous Weekly Low | 1.3493 |
| Previous Monthly High | 1.3640 |
| Previous Monthly Low | 1.3184 |
| Daily Fibonacci 38.2% | 1.3497 |
| Daily Fibonacci 61.8% | 1.3480 |
| Daily Pivot Point S1 | 1.3450 |
| Daily Pivot Point S2 | 1.3416 |
| Daily Pivot Point S3 | 1.3379 |
| Daily Pivot Point R1 | 1.3520 |
| Daily Pivot Point R2 | 1.3558 |
| Daily Pivot Point R3 | 1.3591 |
[/s2If]
Download Nehcap EAWe have two EAs that are operational on our LIVE accounts.
- EA-FIX: Check out the details here. Download EA-FIX . EA-FIX is a non-grid HFT scalper.
- EA-GROWTH: High quality low dd EA using trend grids. Download EA_GROWTHJoin Our Telegram Group
")


