Gold prices have experienced a rebound, rising by 0.25%, as a result of a shift in US bond yields. The 10-year note coupon has decreased from its recent peak of 4.51% to 4.44%, contributing to this recovery.
…
This is a premium post.
[s2If !current_user_can(access_s2member_level4)]Please register for FREE REGISTER to read full post below containing analysis. In case of any error or you think you are not able to read the full post below, please email us at support#nehcap.com [lwa][/s2If] [s2If current_user_can(access_s2member_level1)]
- Gold prices see a recovery, achieving gains of 0.25%, driven by a reversal in US bond yields, with the 10-year note coupon dropping from a 16-year high of 4.51% to 4.44%.
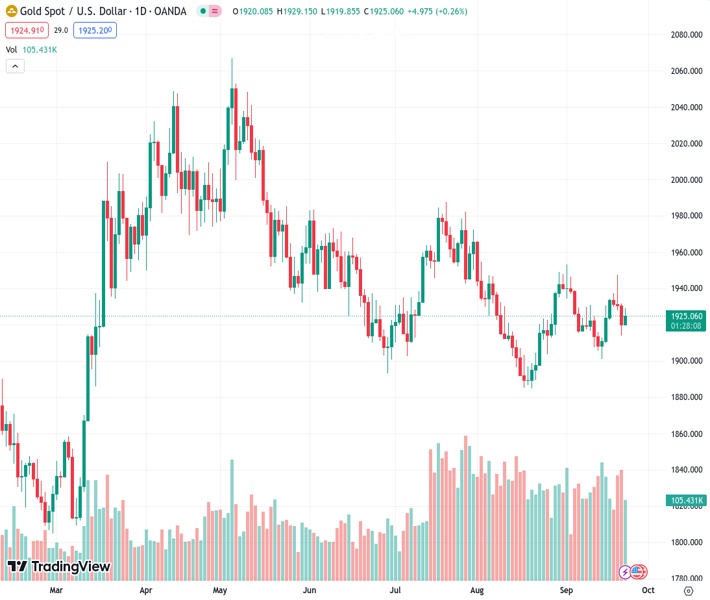
The pair currently trades last at 1924.97.
The previous day high was 1932.04 while the previous day low was 1913.95. The daily 38.2% Fib levels comes at 1920.86, expected to provide support. Similarly, the daily 61.8% fib level is at 1925.13, expected to provide resistance.
Gold price recovers some ground after hitting a weekly low of $1913.99, though it remains shy of breaking solid resistance at around the 50-day moving average (DMA) at $1929.79. Factors like dropping US T-bond yields and an upbeat market sentiment drive XAU/USD’s price toward the current spot at $1924.56, achieving gains of 0.25%.
XAU/USD prices is being driven up by the reversal in US bond yields. The US 10-year benchmark note coupon reversed from a 16-year high of 4.51% towards 4.44%. Consequently, US real yields are edging lower from five basis points from 2.11% to 2.06%.
In the meantime, Federal Reserve officials had turned cautiously, led by Boston and San Francisco Fed Presidents Susan Collins and Mary Daly, stressing that although inflation is cooling down and further rate hikes would be needed, the Fed must be patient. Fed Governor Michelle Bowman commented that more increases are needed to control inflation.
Data-wise, S&P Global announced the final PMI readings in the United States (US). Manufacturing PMI improved to 48.9 but stood at recessionary territory. Contrarily, Services and Composite PMI showed signs of losing steam, though it expanded but continued to aim towards the 50 expansion/contraction threshold.
Meanwhile, the US Dollar Index prints modest gains of 0.17%, stalling Gold’s rally. The DXY sits at 105.56, set to print solid gains for the tenth straight week.
On the US front, Consumer Confidence, Durable Goods Orders, Initial Jobless Claims, and the Fed’s preferred gauge for inflation the core PCE.
From a technical standpoint, the XAU/USD is set to continue to trade sideways, within the $1913-$1948 range, with most daily moving averages (DMAs) hovering around the current exchange rate. However, as the yellow metal remains below the 200-DMA, which sits at $1926.24, the path of least resistance is tilted to the downside. First support would be the September 21 low of $1913.99, followed by the September 14 $1901.11 swing low. Conversely if the non-yielding metal surpass the 100-DMA at $1941.86, a challenge of the $1950 mark is expected.
Technical Levels: Supports and Resistances
XAUUSD currently trading at 1925.07 at the time of writing. Pair opened at 1920.08 and is trading with a change of 0.26 % .
| Overview | Overview.1 | |
|---|---|---|
| 0 | Today last price | 1925.07 |
| 1 | Today Daily Change | 4.99 |
| 2 | Today Daily Change % | 0.26 |
| 3 | Today daily open | 1920.08 |
The pair is trading below its 20 Daily moving average @ 1925.47, below its 50 Daily moving average @ 1930.63 , below its 100 Daily moving average @ 1943.18 and above its 200 Daily moving average @ 1924.83
| Trends | Trends.1 | |
|---|---|---|
| 0 | Daily SMA20 | 1925.47 |
| 1 | Daily SMA50 | 1930.63 |
| 2 | Daily SMA100 | 1943.18 |
| 3 | Daily SMA200 | 1924.83 |
The previous day high was 1932.04 while the previous day low was 1913.95. The daily 38.2% Fib levels comes at 1920.86, expected to provide support. Similarly, the daily 61.8% fib level is at 1925.13, expected to provide resistance.
Note the levels of interest below:
- Pivot support is noted at 1912.01, 1903.93, 1893.92
- Pivot resistance is noted at 1930.1, 1940.11, 1948.19
| Levels | Levels.1 |
|---|---|
| Previous Daily High | 1932.04 |
| Previous Daily Low | 1913.95 |
| Previous Weekly High | 1930.77 |
| Previous Weekly Low | 1901.07 |
| Previous Monthly High | 1966.08 |
| Previous Monthly Low | 1884.85 |
| Daily Fibonacci 38.2% | 1920.86 |
| Daily Fibonacci 61.8% | 1925.13 |
| Daily Pivot Point S1 | 1912.01 |
| Daily Pivot Point S2 | 1903.93 |
| Daily Pivot Point S3 | 1893.92 |
| Daily Pivot Point R1 | 1930.10 |
| Daily Pivot Point R2 | 1940.11 |
| Daily Pivot Point R3 | 1948.19 |
[/s2If]
Download Nehcap EAWe have two EAs that are operational on our LIVE accounts.
- EA-FIX: Check out the details here. Download EA-FIX . EA-FIX is a non-grid HFT scalper.
- EA-GROWTH: High quality low dd EA using trend grids. Download EA_GROWTHJoin Our Telegram Group
")


